

2025
The purpose of this survey is to help the Data Visualization Society and the broader data visualization community understand the state of data visualization, the people who make it, the challenges they face, what can help practitioners, and where the field is headed.
Who should take this survey?
Whether you are primarily focused on data visualization in your work or simply using it as one of many skills to accomplish your main goal, we want to hear from you!
It doesn’t matter if you’re making data visualization with a tool, code, pen & paper, or other media, whether you do it once a year or every day. This survey welcomes input from DVS members and non-members alike.
What you can learn from the survey responses:
Here is a peek at what we’ve learned from last year’s survey in the 2024 State of the Data Viz Industry report, representing 763 responses from 58 countries:
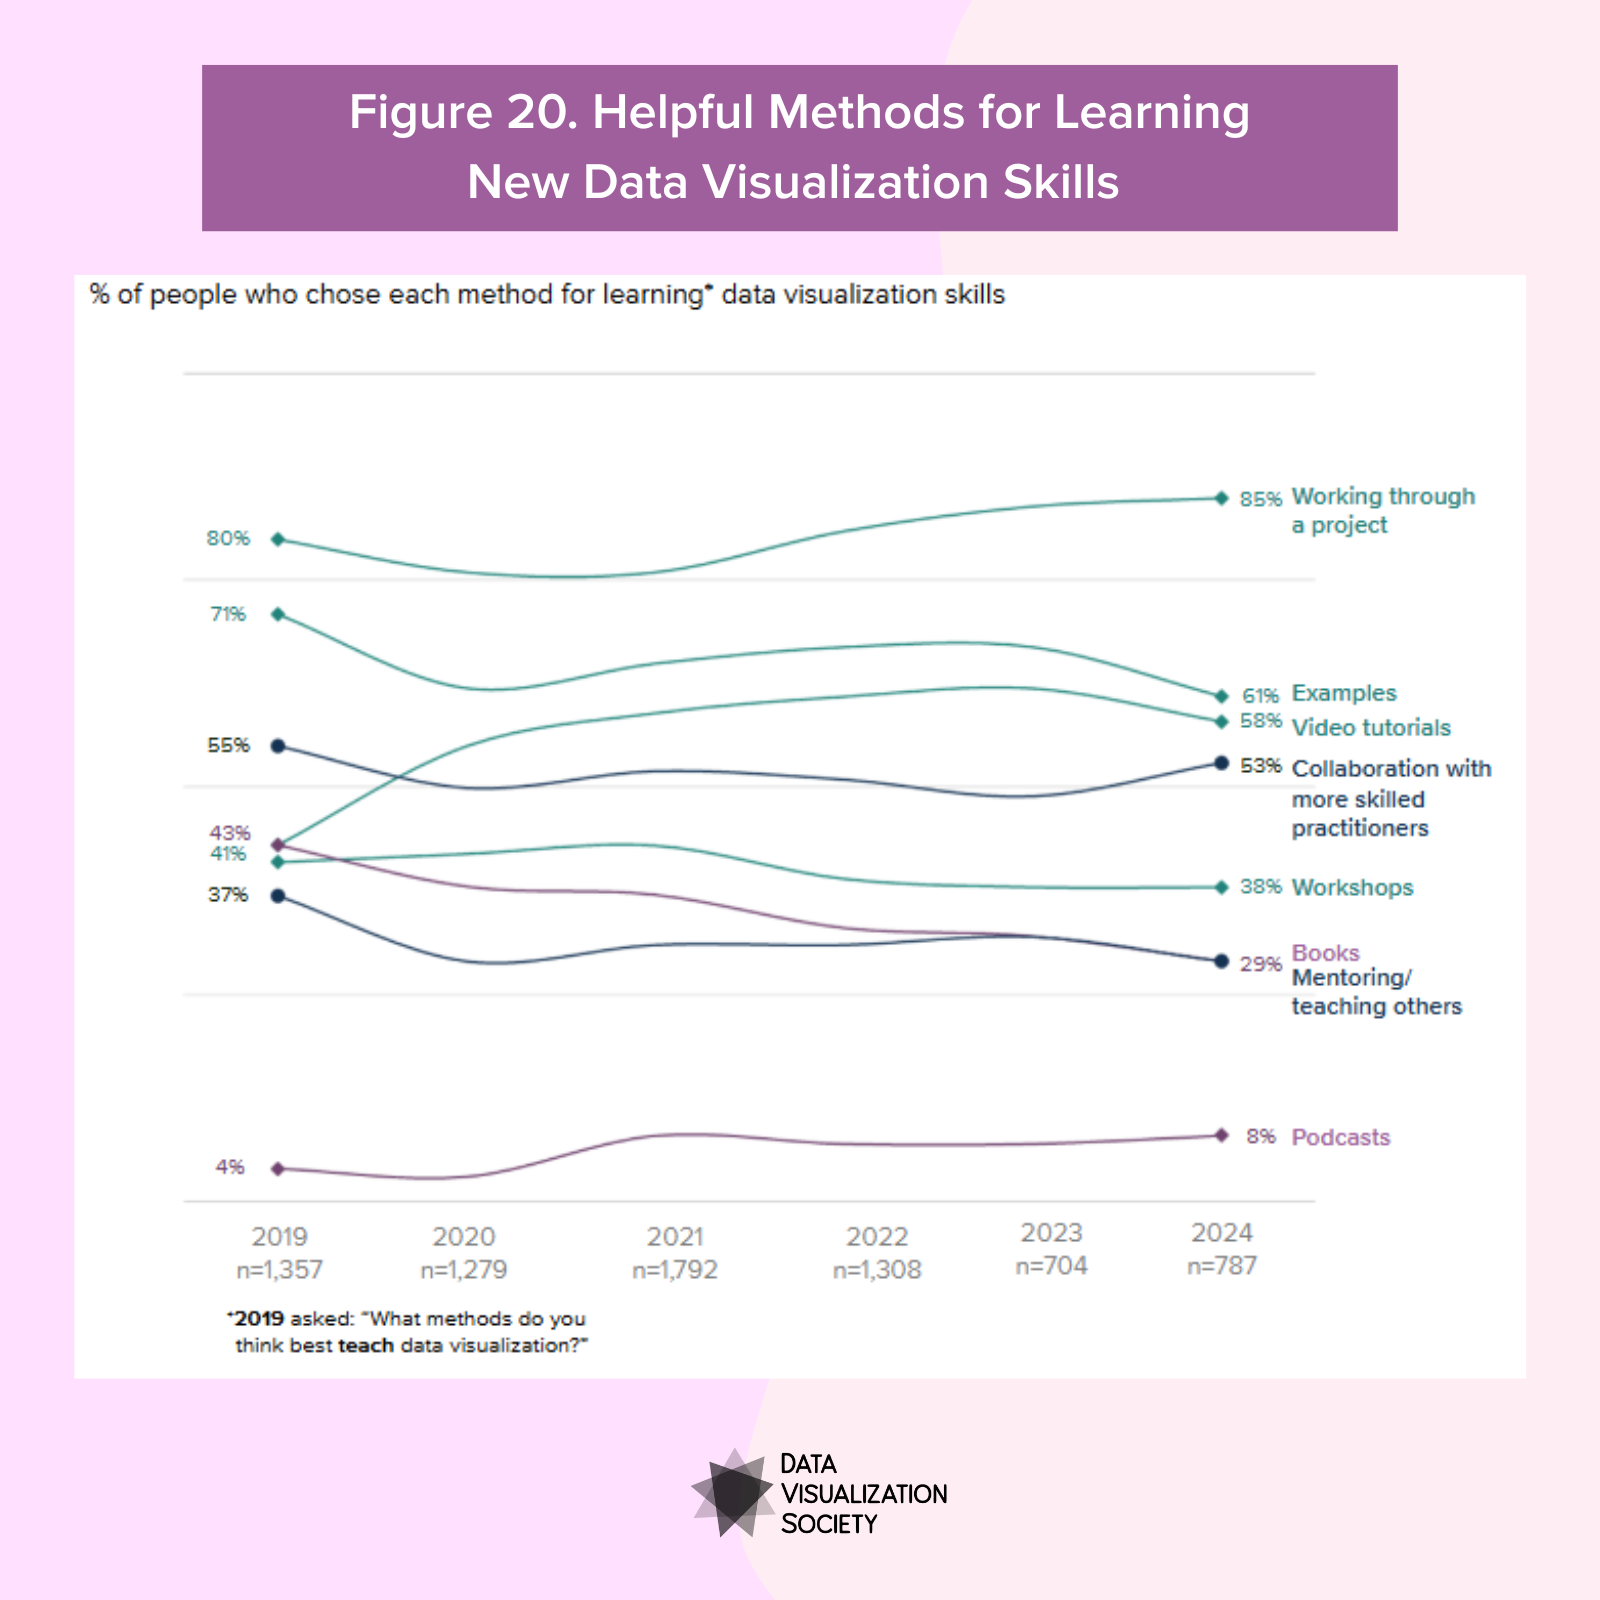
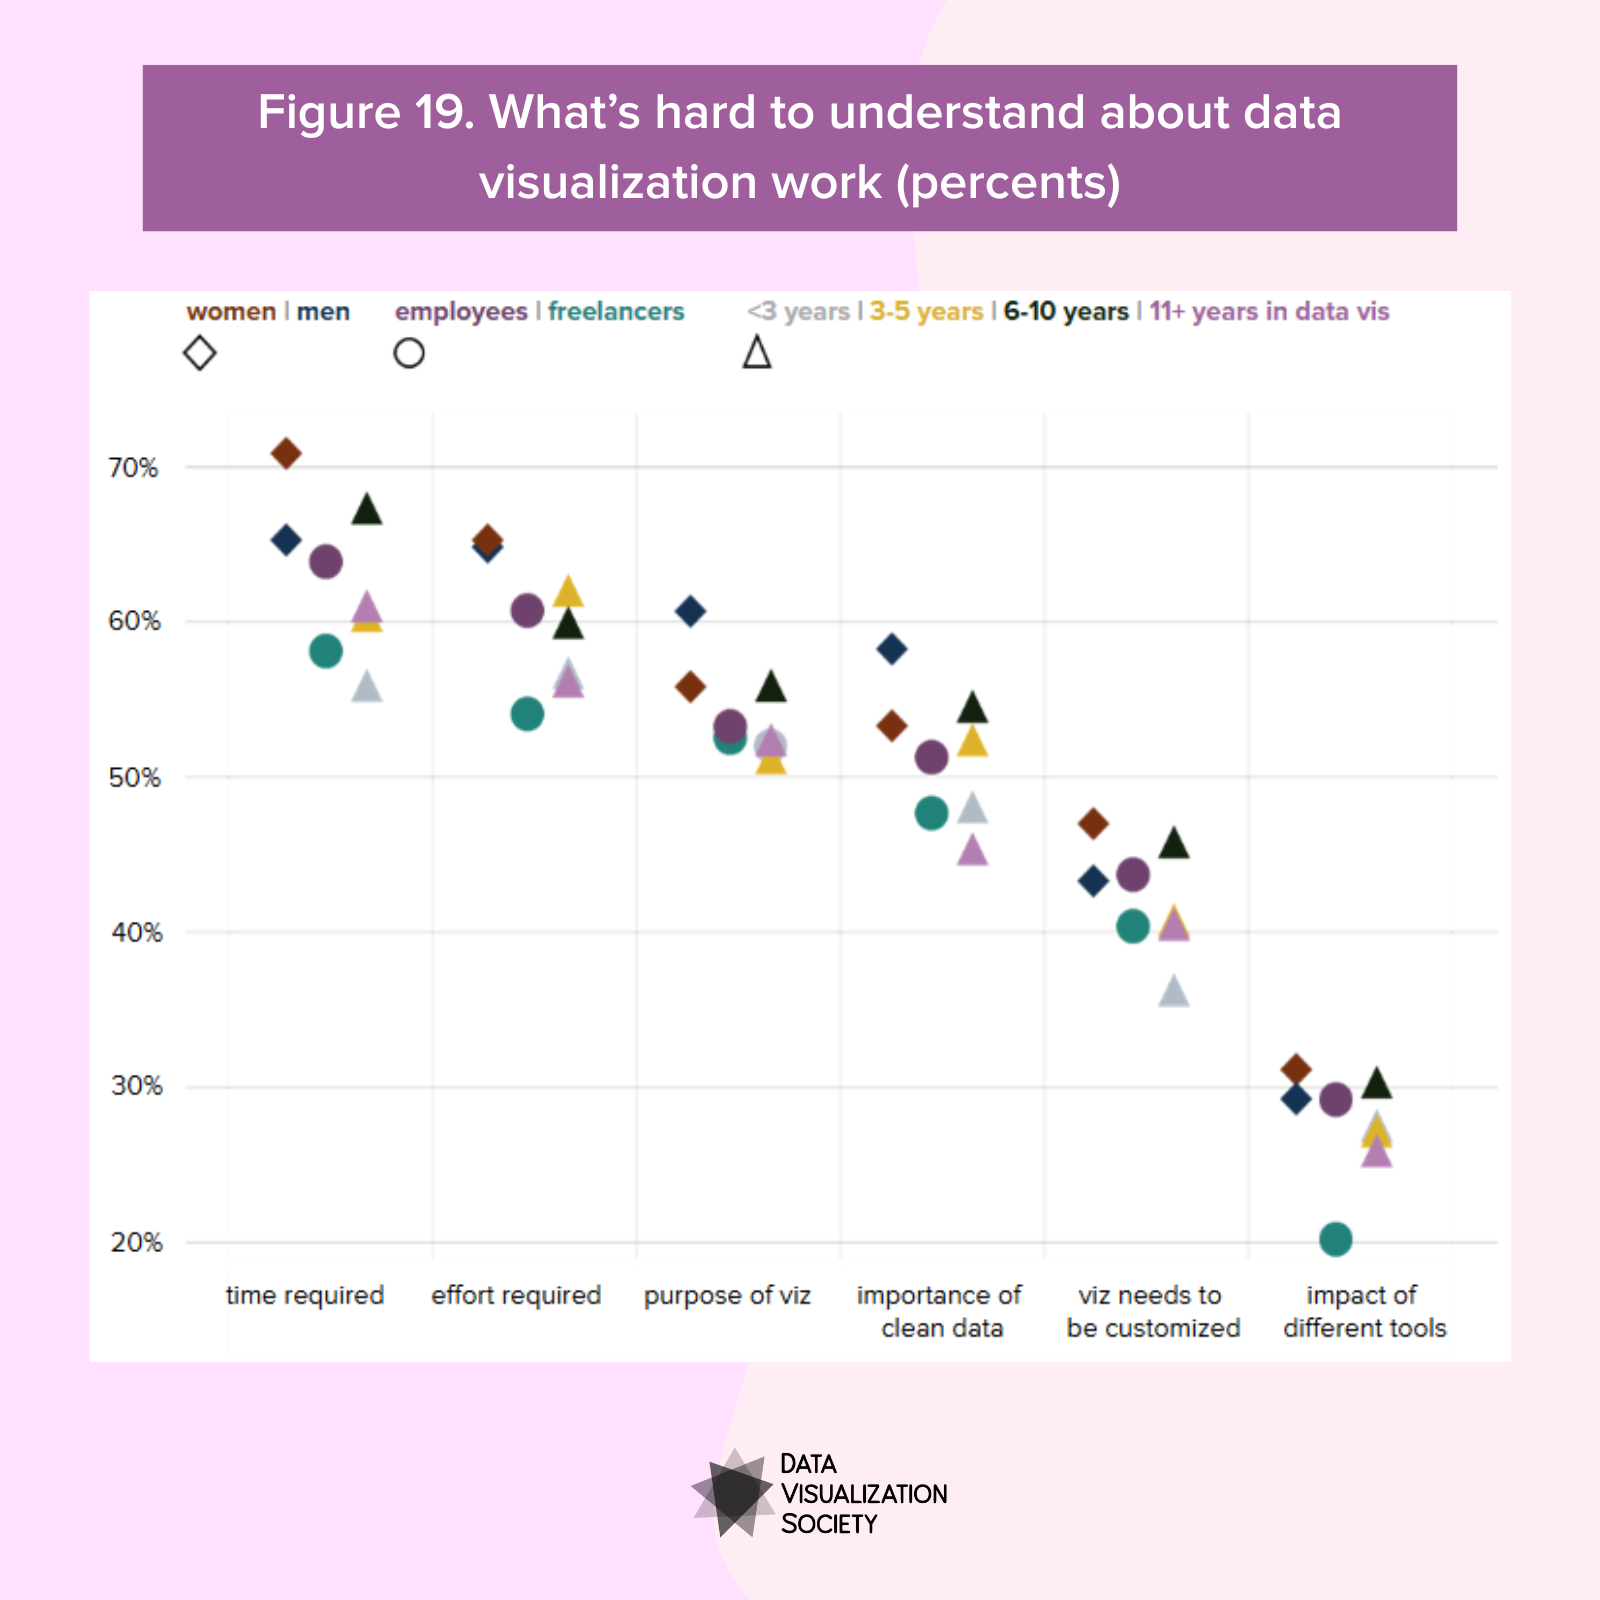
Enjoy free access to the 2024 report while the survey is open. Read on to uncover last year’s findings.
Frequently Asked Questions
-
All answers are anonymous. This survey collects no directly identifying information: no email addresses, no names, etc.
Any potentially identifying information (e.g., job titles) will be kept strictly confidential, accessible only by DVS team members who have agreed to specific non-disclosure and data privacy controls. An anonymized version of the dataset, in which potentially identifying information is removed or coarsened, will be released to the public on GitHub and via Google Sheets. See the results from 2020 (GitHub), results from 2021,2022, and 2023(Google Sheets), and Survey Hero’s Privacy Policy.
In compliance with the GDPR, you may contact programs@datavisualizationsociety.org with “Survey” in the subject line to have your data removed from the dataset.
By filling out this survey you agree that we will process your data in line with the privacy policy detailed above.
See our Survey History page for earlier versions of the survey, the data, and accompanying visualizations.
-
Questions are organized into eight main sections:
Roles and Experience
Pay and Location
Your Data Viz Work
Charts and Tools
Challenges and Changes
Looking Ahead
Time and Inspiration
Demographics
The entirety should take about 15–20 minutes to complete (depending on your role(s) and/or interest in data visualization). All questions are optional.
Some questions ask you to put yourself or your perspectives into categories. We have such a diverse field that includes people representing many paths to and roles within data visualization. We aim to be inclusive and broad in our approach, but we may not perfectly capture your unique experience in every case.
If the survey lists options that are close to your experience, we encourage you to choose those. Either way, feel free to fill out the “Other (please specify)” options throughout the survey. All write-ins that do not compromise privacy are shared in the published dataset.
-
By taking this survey, you contribute to a multi-year dataset that helps practitioners
Identify benchmarks for income decisions;
Explore questions about tools usage, career paths, learning resources, and more
Recommend ways to serve the international data visualization community better
How DVS engages results, including unpublished data:
Sample tools for Benchmarking Income:
Data Explorations:
Career Paths in Data Visualization: The Data Exploration Journey
Reports:
Data Visualization State of the Industry: 2023 Report
Career Paths in Data Visualization: The Report
Data Visualization State of the Industry: 2022 Report
Data Visualization State of the Industry: 2021 Report
challenge participants’ process writeups
Spread the word!
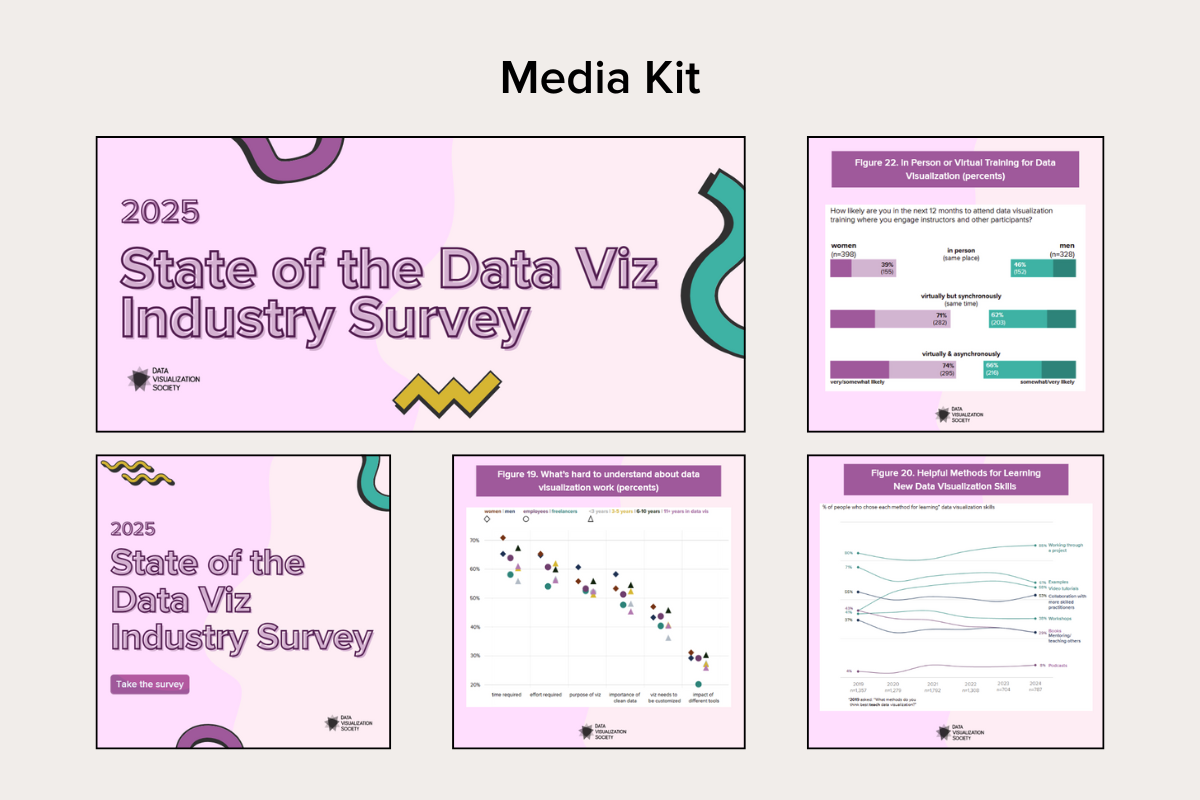
Please share the survey with everyone you know who works, is learning, or has a hobby in this field! You can help spread the word about the survey with our media kit.
Our non-profit organization is creating surveys with SurveyHero.com.
Questions? Email programs@datavisualizationsociety.org