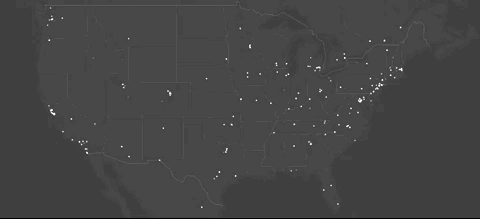
Guest User May 4, 2020 One Year of Data Visualization Society Membership in the U.S. Guest User May 4, 2020 by Huy Nguyen
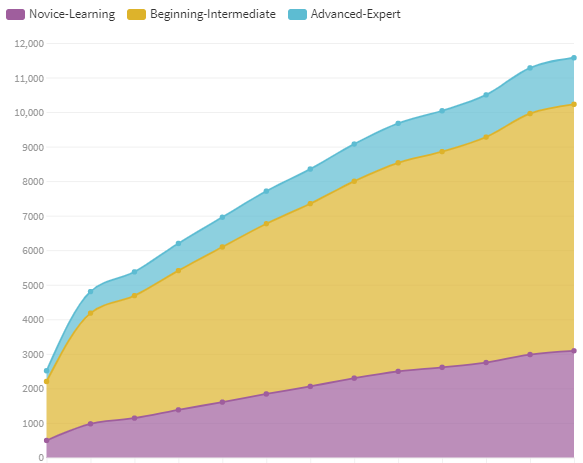
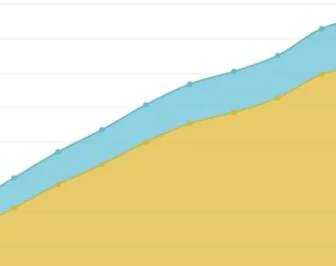
Guest User May 4, 2020 The first year of Data Visualization Society (DV Guest User May 4, 2020 by Vinícius Cassio Barqueiro
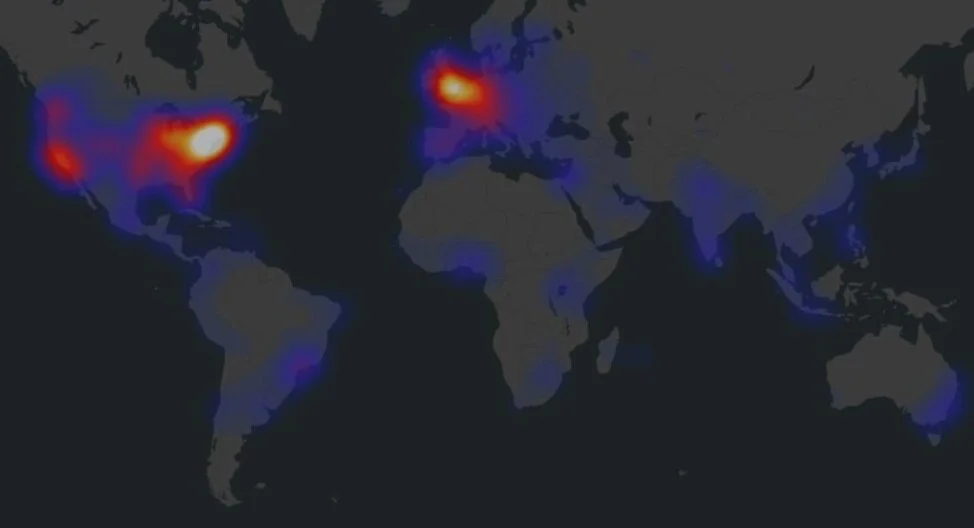
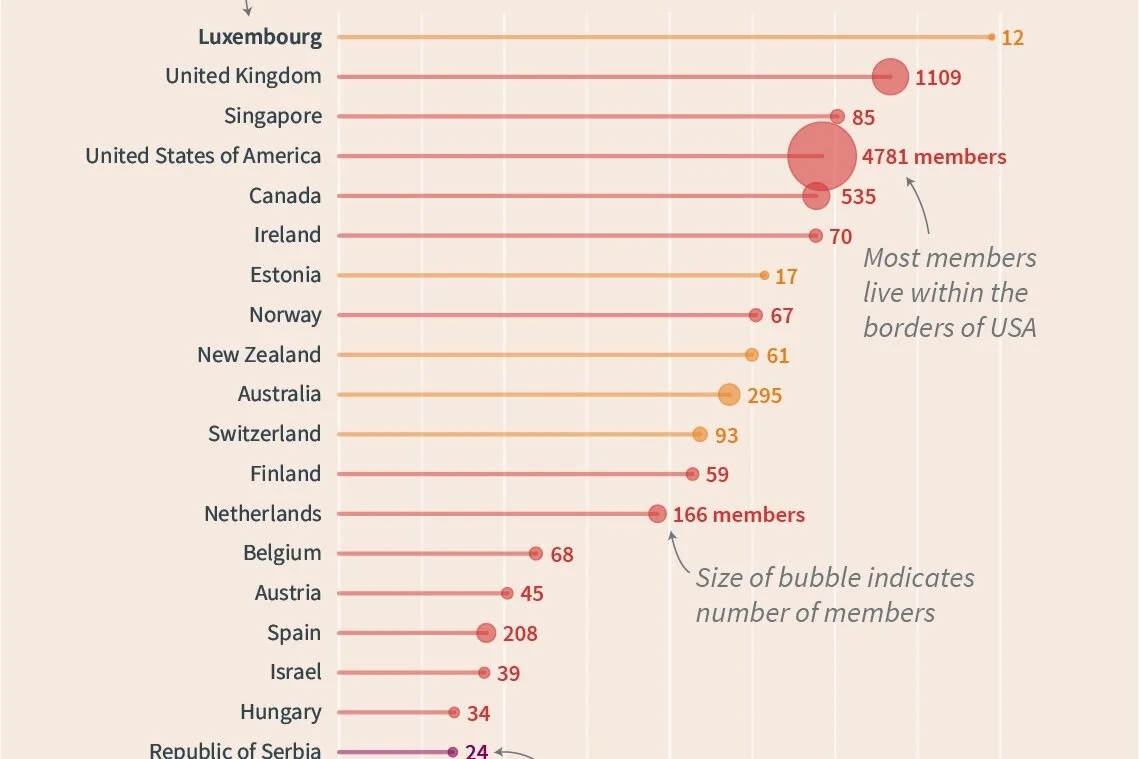
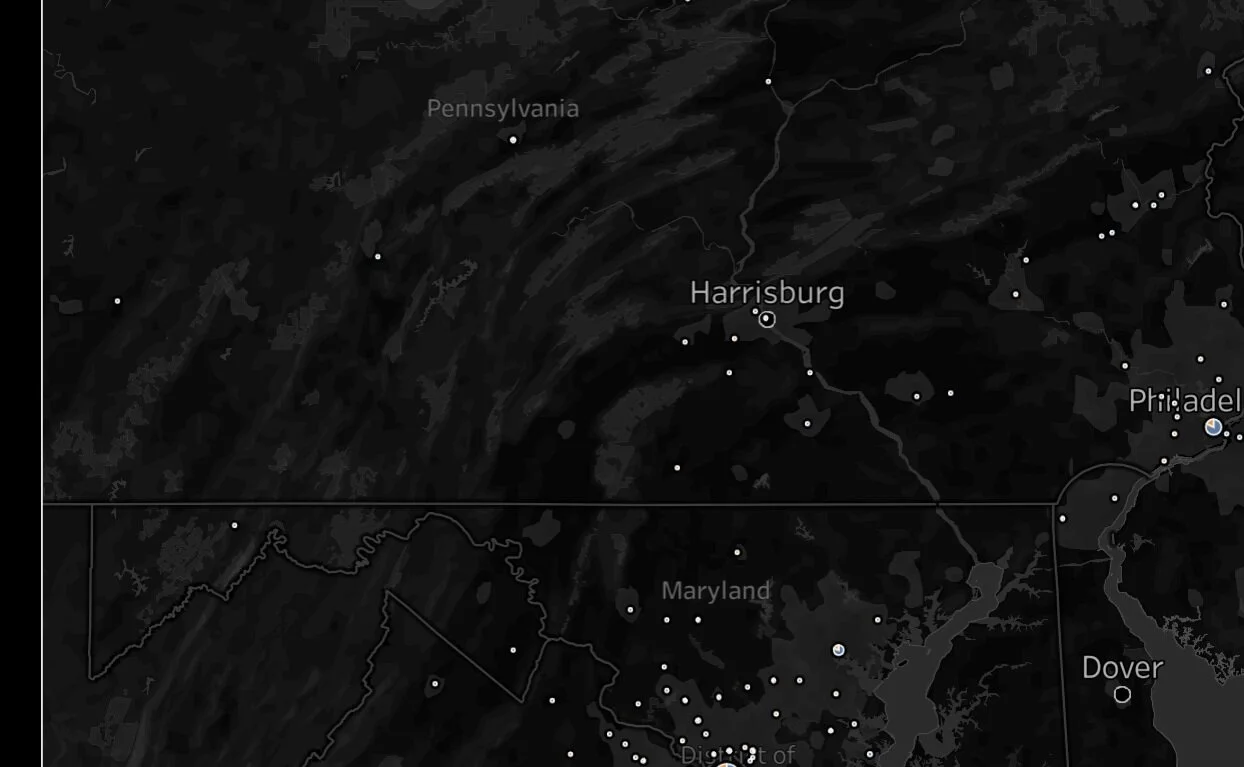
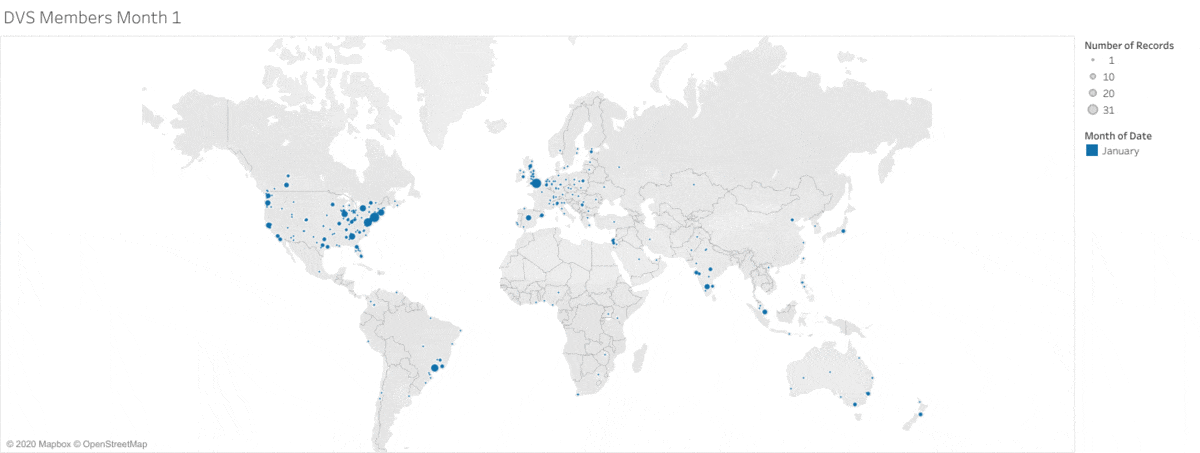
Guest User May 4, 2020 Data Visualization Society Members Heat Map Guest User May 4, 2020 by Rakim T. Reid - Old Dominion University
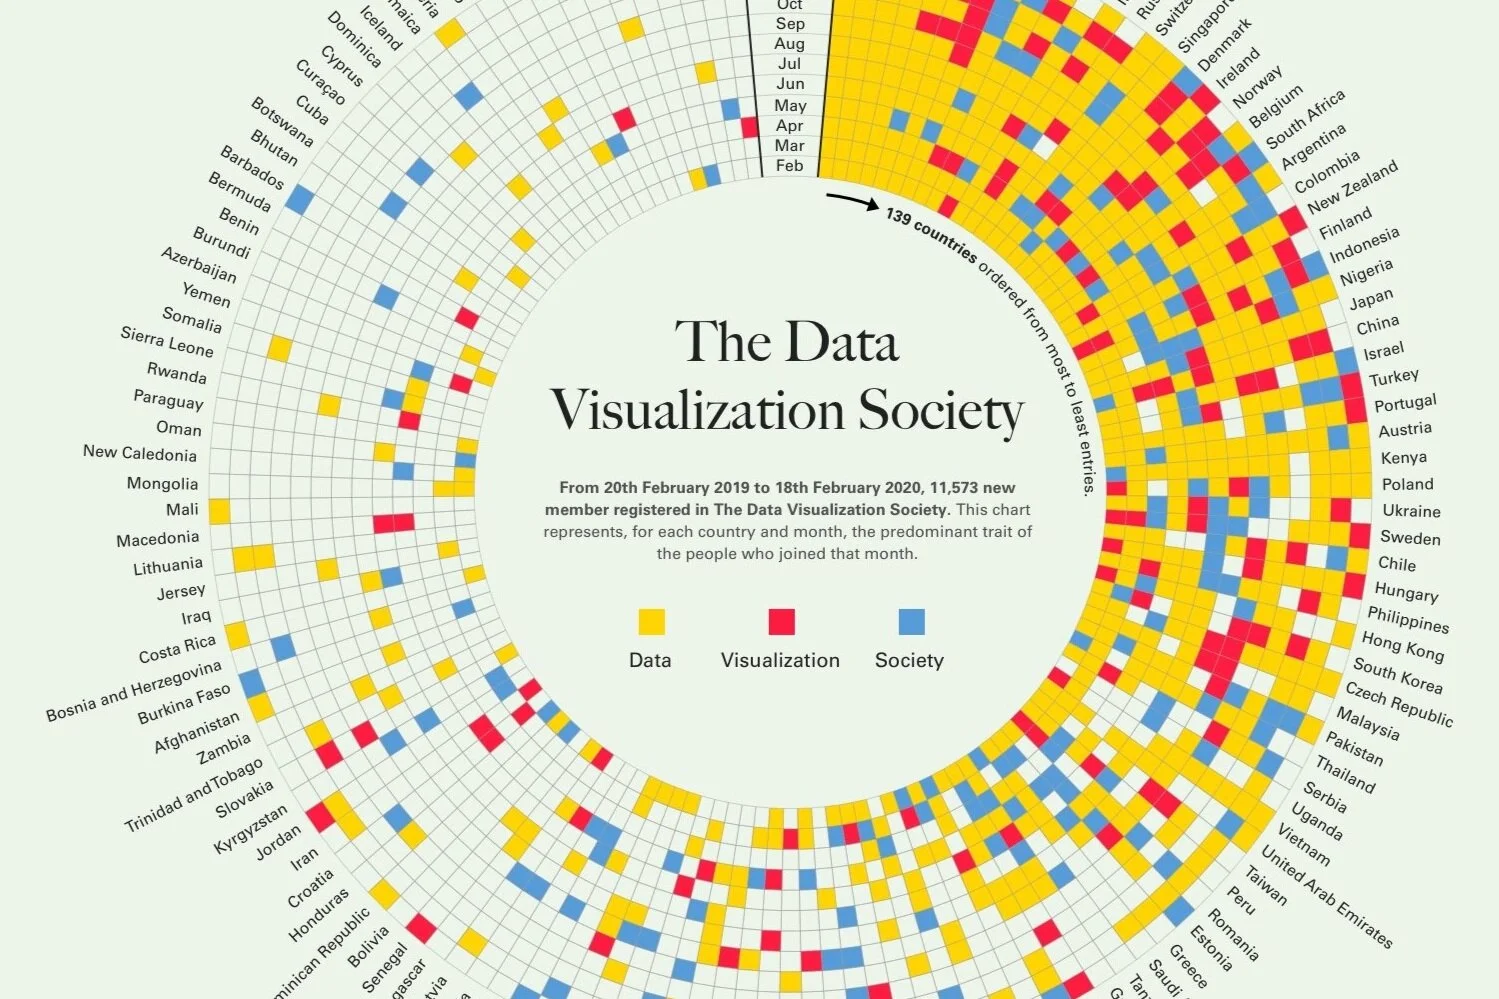
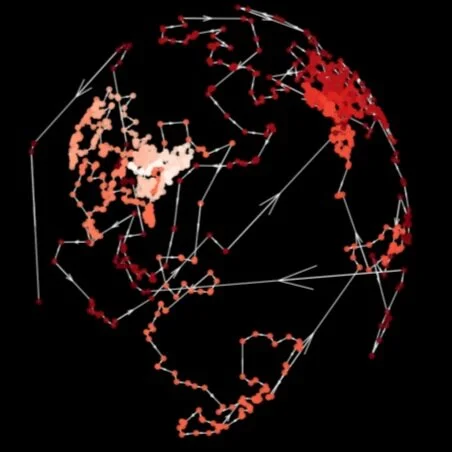
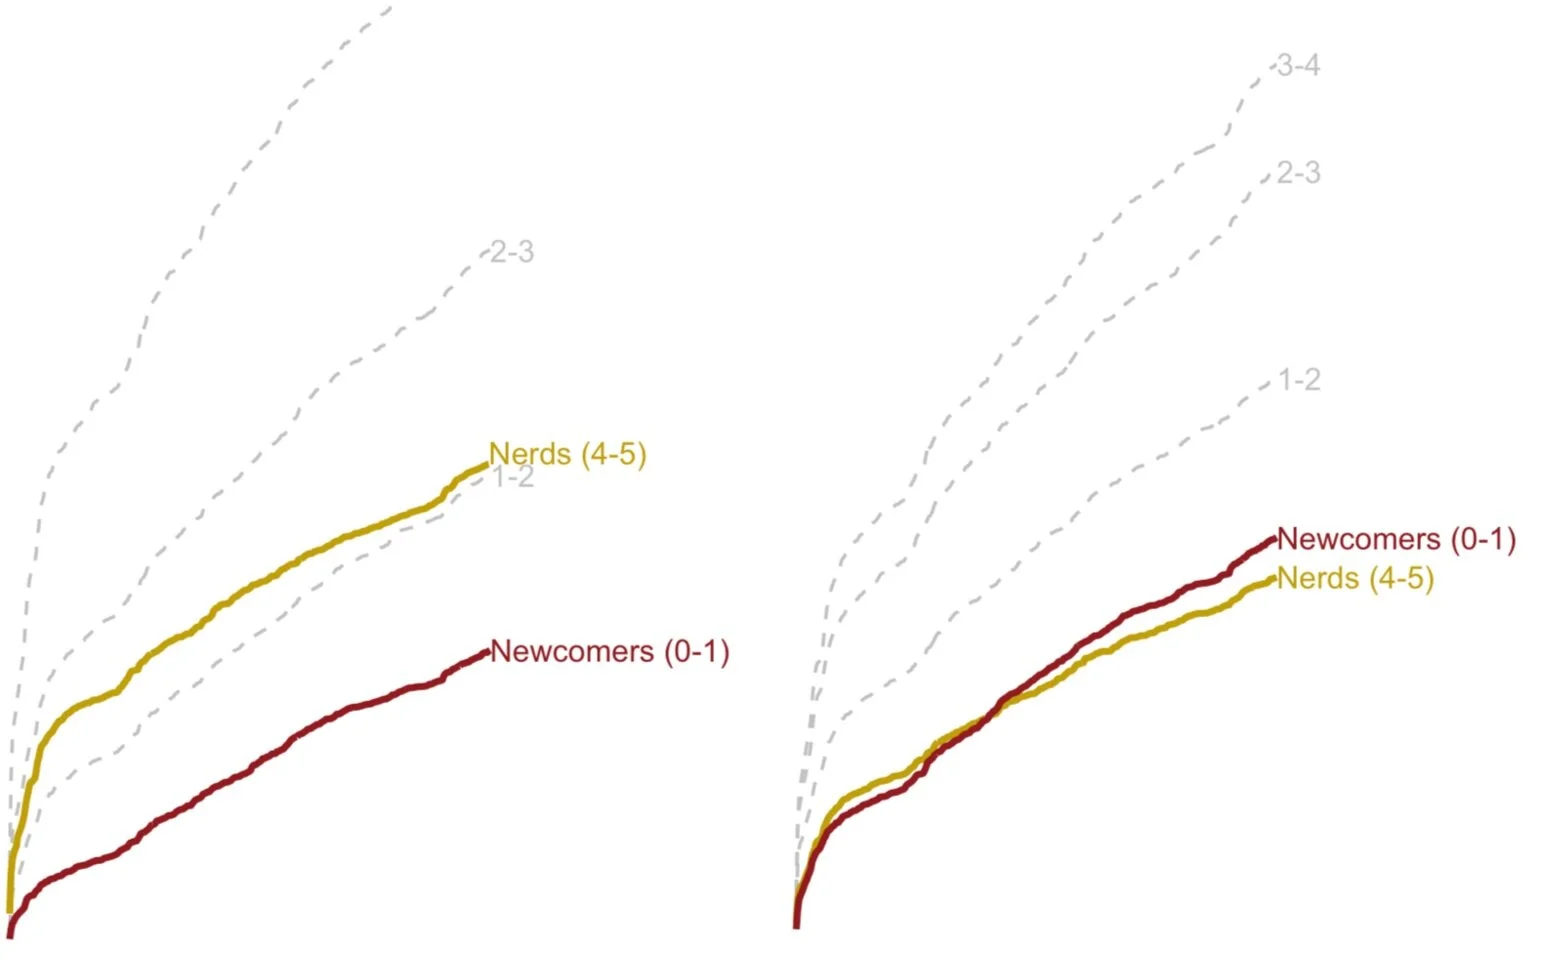
Guest User May 4, 2020 The DVS dominant traits across space and time Guest User May 4, 2020 by Greta C. Vega & Estefanía Casal
Guest User May 4, 2020 O primeiro ano da DVS e a importância da visualização de dados Guest User May 4, 2020 by Vinícius Cassio Barqueiro
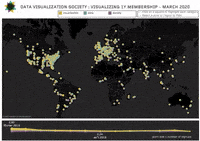
Guest User May 4, 2020 DATA VISUALIZATION SOCIETY : VISUALIZING 1Y MEMBERSHIP - MARCH 2020 Guest User May 4, 2020 by @Gwen A
Guest User May 4, 2020 Infographic of Data Visualization Society's Members since 2019 Guest User May 4, 2020 by Aloysius Ong Wei Han
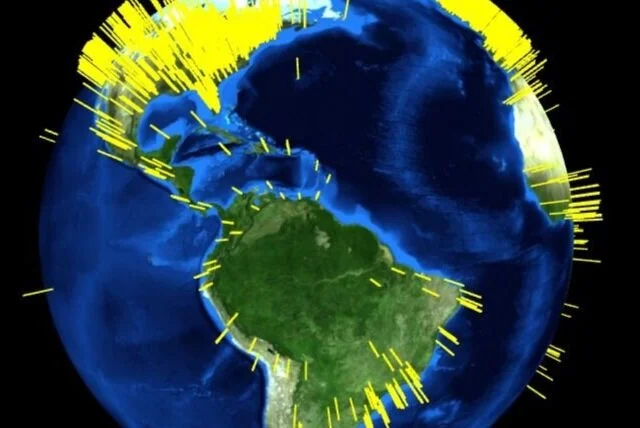
Guest User May 4, 2020 Global visualization of DVS members Guest User May 4, 2020 by Pranavathiyani G