

CREATED BY: Aloysius Ong Wei Han
DESCRIPTION:
I found 3 interesting insights within the data and compiled them instead of creating a dashboard visualizing the data.
PROCESS:
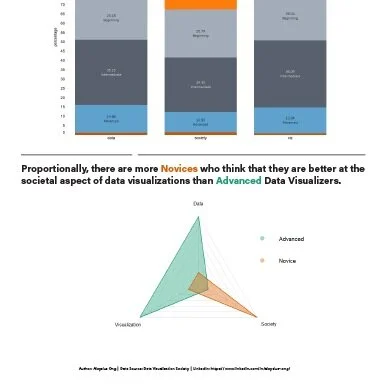
I actually created many different vizzes and realised that they were very similar to each other. That was how I came up with a stacked bar chart. To narrow it down further, I created a radar chart to show how the different skill levels were distributed.