

CREATED BY: Pranavathiyani G (@pranavathiyani)
DESCRIPTION:
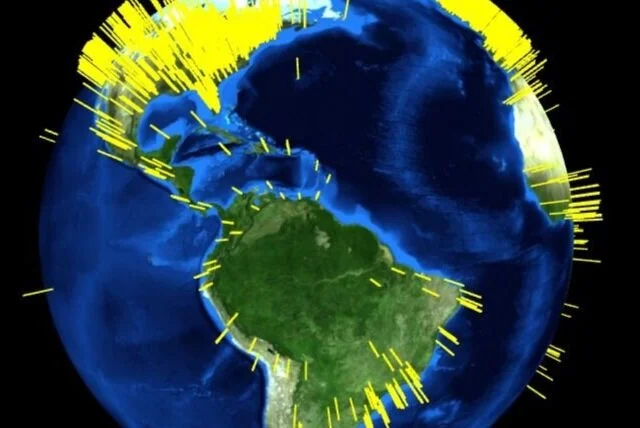
An interactive global map of DVS members' using latitude and longitude data. Point size represents the log sum of data, visualization and society from the DVS challenge data.
PROCESS:
Visualization is based on "Building an Interactive Globe Visualization in R" by Jake Hoare in DisplayR Blog (https://www.displayr.com/interactive-globe-r/).
The interactive html document is shared as Google Drive link with Gif https://drive.google.com/open?id=1zcUzm76H9Rn0vvJyZNHaEBkw-cyJ7xpU