home
Memberships
General Membership
Institutional Memberships
News
For Members
Member Portal
Dataviz Research Recruitment
Slack Community
Programs
Outlier
Mentorship
Dataviz Events Calendar
Reports
State of the Data Viz Industry Survey
Challenges
Affiliated Groups
IIB Awards
Nightingale
Order Nightingale Magazine
Nightingale
Write For Nightingale
Digital Version of Nightingale Print Magazine
Jobs Board
About
Mission
Support DVS
Board and Council
Committees
Nominations
Work With Us

Data Visualization Society

home
Memberships
General Membership
Institutional Memberships
News
For Members
Member Portal
Dataviz Research Recruitment
Slack Community
Programs
Outlier
Mentorship
Dataviz Events Calendar
Reports
State of the Data Viz Industry Survey
Challenges
Affiliated Groups
IIB Awards
Nightingale
Order Nightingale Magazine
Nightingale
Write For Nightingale
Digital Version of Nightingale Print Magazine
Jobs Board
About
Mission
Support DVS
Board and Council
Committees
Nominations
Work With Us
Visualizing the first 3,500 DVS members by sign-up time
March 29, 2019
Member Data
Guest User
Visualizing the first 3,500 DVS members by sign-up time
Guest User
March 29, 2019
Member Data

Visualizing the first 3,500 DVS members by sign-up time

Guest User
March 29, 2019
Member Data

CREATED BY: Jared Whalen

DESCRIPTION:

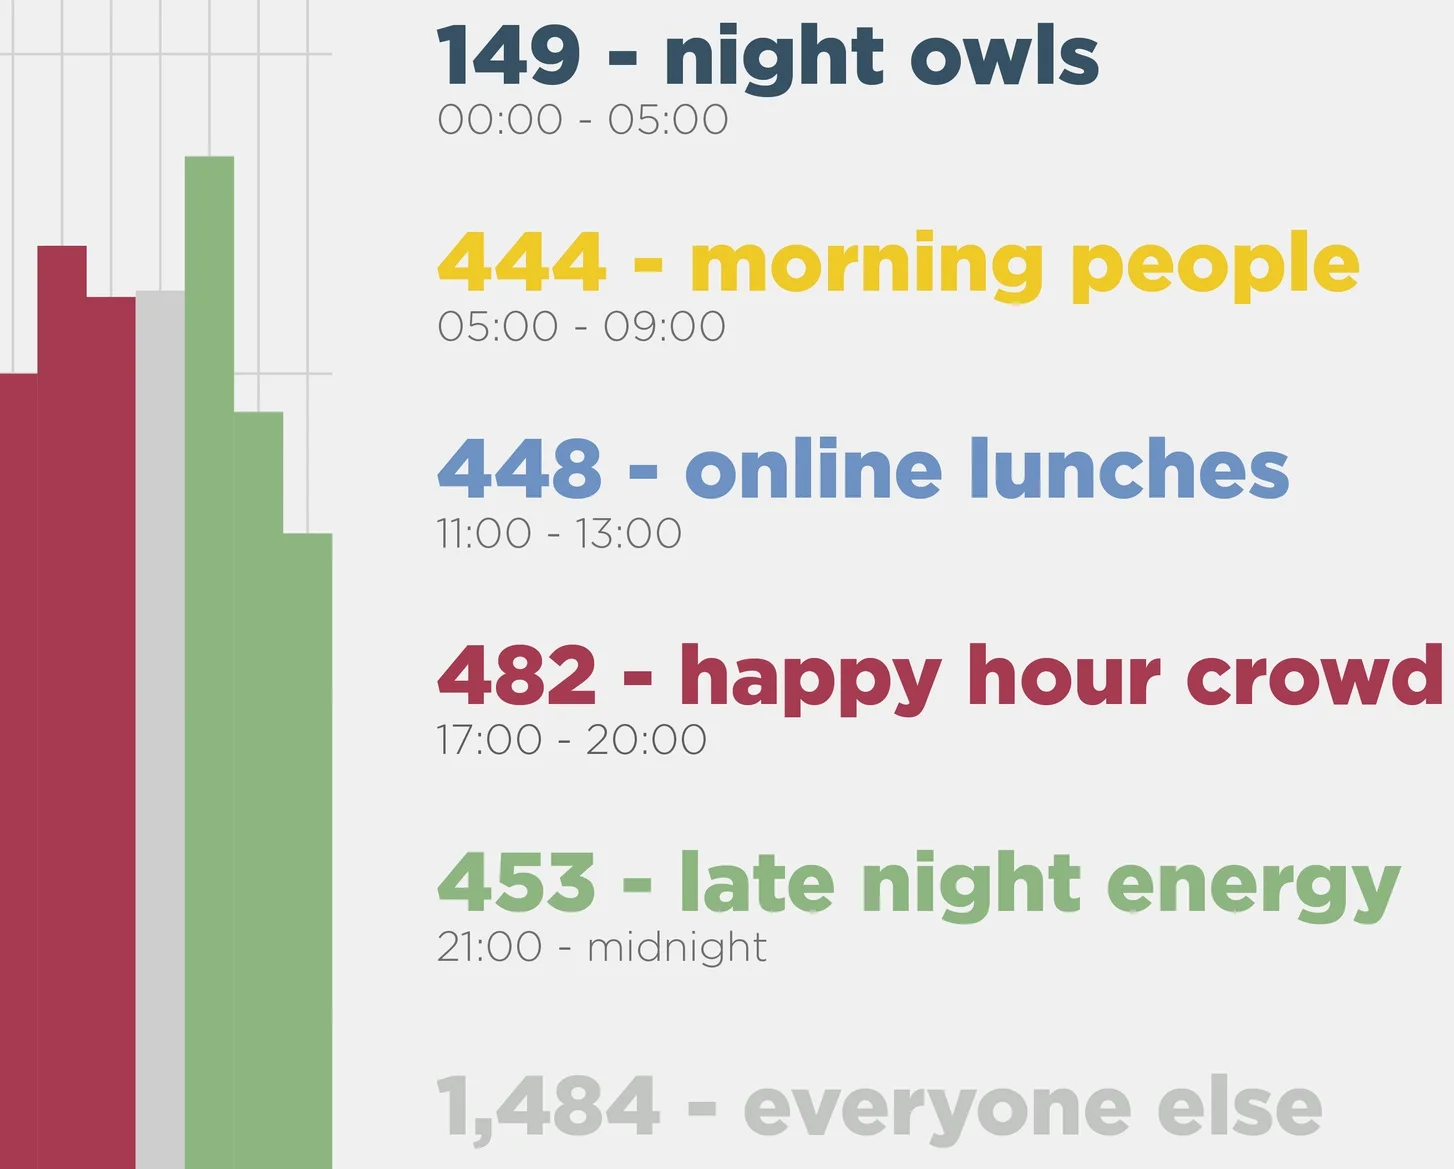
Using the coordinates to determine local time, I grouped the sign ons by hour and specified playful groupings.

PROCESS FOR CREATION:

Qgis + UTC shapefile to get the local time.
R (dplyr, ggplot) to visualize
Illustrator to style

Tagged: plot, QGIS, R, Illustrator, ggplot2

Newer PostVisu.ai Interactive data map
Older PostThe Data Visualization Society Membership Timeline
Back to Top
datavisualizationsociety@gmail.com

Code of Conduct | Bylaws | Privacy Policy | X | Bluesky | Instagram | LinkedIn | YouTube | Merch Store | Brand Guidelines | Contact us