

CREATED BY: Francois Dion - fdion@dionresearch.com
DESCRIPTION:
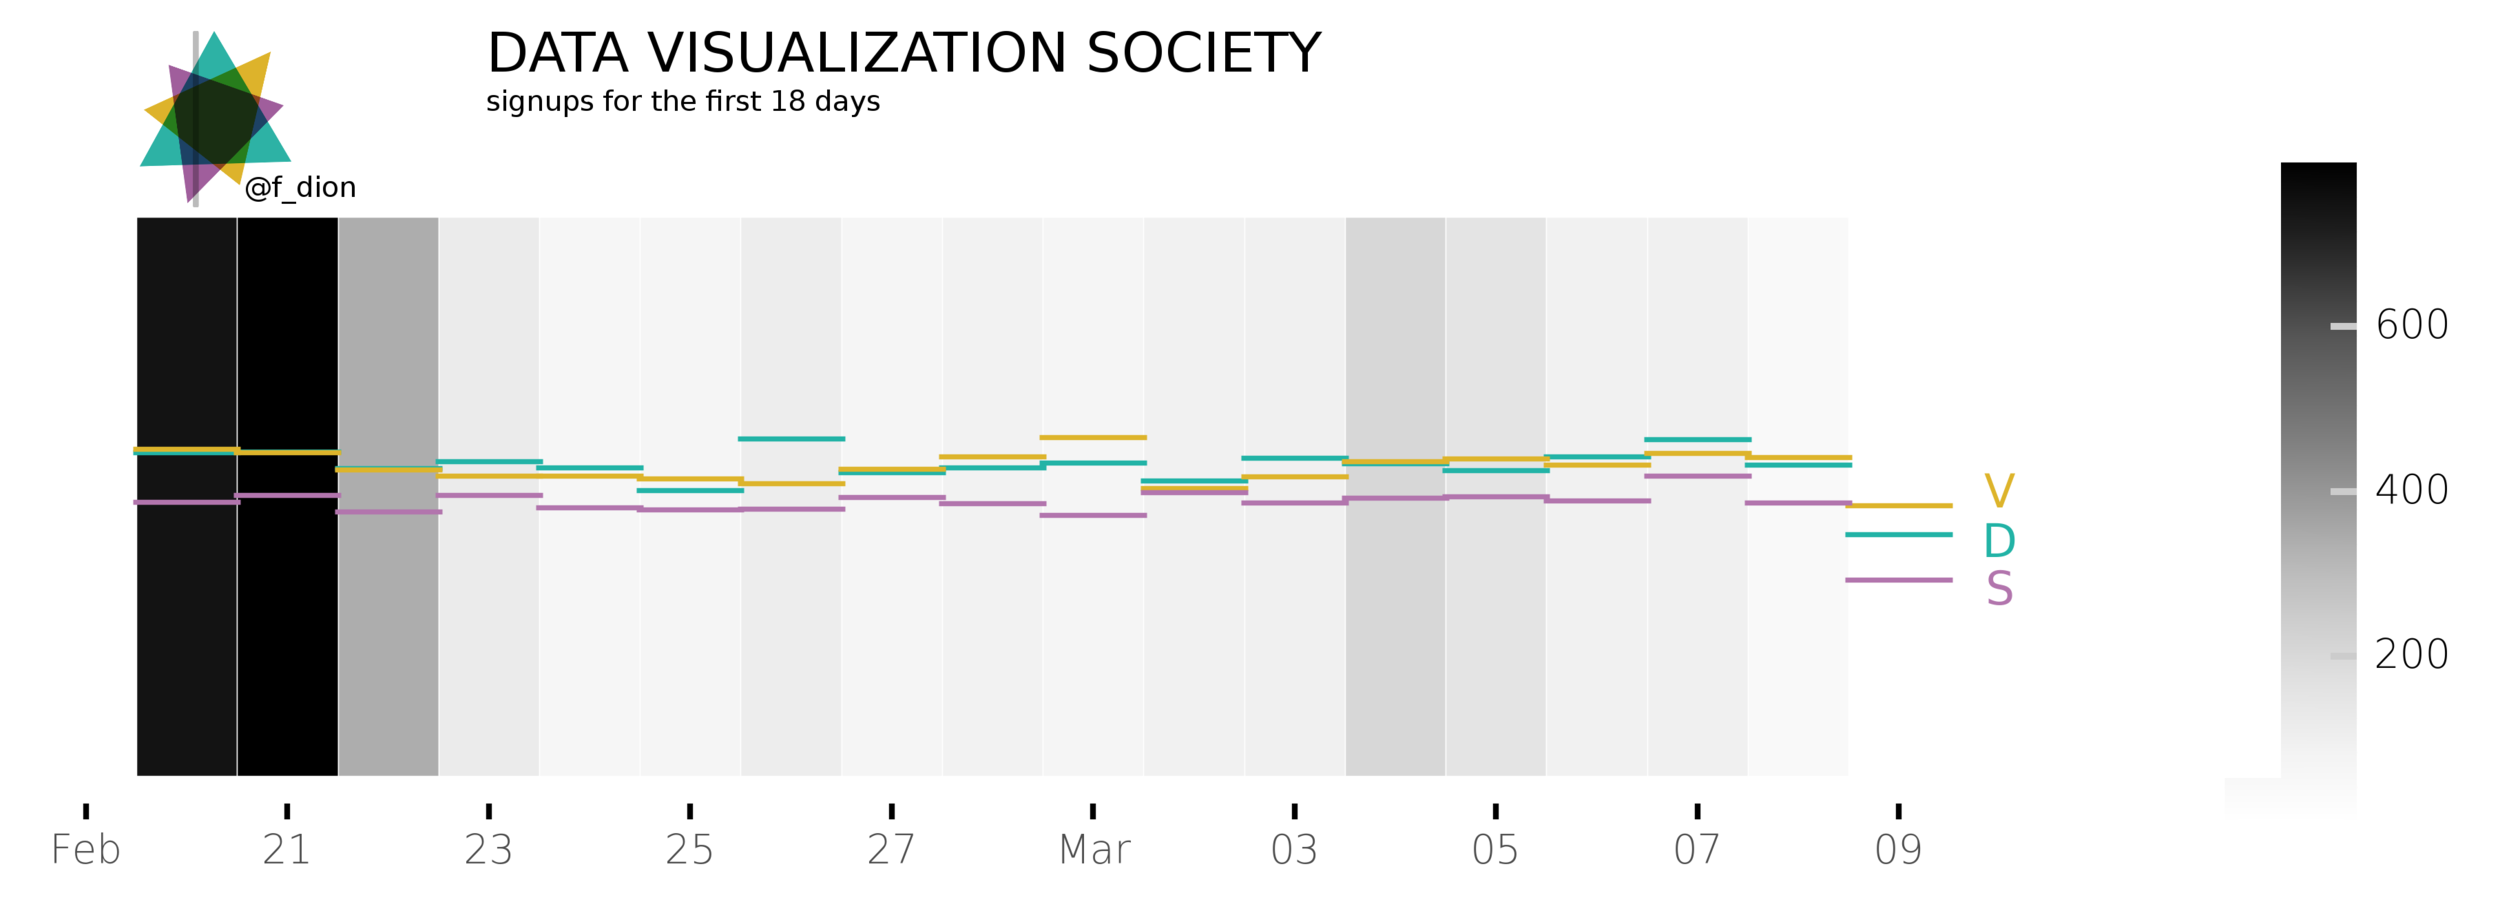
1D heatmap representing the daily signups, along with the average daily score for Data, Visualization and Society.
PROCESS FOR CREATION:
Mostly jupyter notebook and python. For this one I added my personal DVS badge using Gimp, after the plot was generated and exported from the notebook as a PNG.