home
Memberships
General Membership
Institutional Memberships
News
For Members
Member Portal
Dataviz Research Recruitment
Slack Community
Programs
Outlier
Mentorship
Dataviz Events Calendar
Reports
State of the Data Viz Industry Survey
Challenges
Affiliated Groups
IIB Awards
Nightingale
Order Nightingale Magazine
Nightingale
Write For Nightingale
Digital Version of Nightingale Print Magazine
Jobs Board
About
Mission
Support DVS
Board and Council
Committees
Nominations
Work With Us

Data Visualization Society

home
Memberships
General Membership
Institutional Memberships
News
For Members
Member Portal
Dataviz Research Recruitment
Slack Community
Programs
Outlier
Mentorship
Dataviz Events Calendar
Reports
State of the Data Viz Industry Survey
Challenges
Affiliated Groups
IIB Awards
Nightingale
Order Nightingale Magazine
Nightingale
Write For Nightingale
Digital Version of Nightingale Print Magazine
Jobs Board
About
Mission
Support DVS
Board and Council
Committees
Nominations
Work With Us
Guest User
November 9, 2019
exploratory

Geographical Trends of Data Visualizers

Guest User
November 9, 2019
exploratory
Geographical Trends of Data Visualizers

created by Diana

Source: https://dianameow.com/DVSchallenge/

Tagged: animated, python, javascript, D3

Guest User
November 9, 2019
exploratory

Data Viz Professional Salary

Guest User
November 9, 2019
exploratory
Data Viz Professional Salary

created by Charles Sutton, Owner of Impacsis

Source: https://public.tableau.com/profile/charlesutton#!/vizhome/DataVizProfessionalSalary/Howmuchdodatavizprosmakeanhour?publish=yes

Tagged: bi tool, Tableau

Guest User
November 9, 2019
exploratory

2019 DVS SURVEY - SALARY EXPLORER

Guest User
November 9, 2019
exploratory

created by Thomas Gonzalez - BrightPoint Consulting

Source: http://brightpointinc.com/labs/dvs/dvs-2019.html

Tagged: animated, javascript, hand-made, Vizuly.io and D3.js

Guest User
November 9, 2019
exploratory

What does the 2019 DVS Survey tell about us?

Guest User
November 9, 2019
exploratory
What does the 2019 DVS Survey tell about us?

created by Arihant Parsoya

Source: https://info-design-lab.github.io/DVS-Survey/

Tagged: javascript, D3.js

Guest User
November 9, 2019
exploratory

One Line - One Community (?)

Guest User
November 9, 2019
exploratory
One Line - One Community (?)

created by Joseph Berkner (Geolic)

Source: https://geolic.net/one-line-one-community

Tagged: animated, plot, javascript, path chart, single line, d3.js

Guest User
November 9, 2019
exploratory

The Garden

Guest User
November 9, 2019
exploratory
The Garden

created by Andreia Ribeiro (3rd Place in Exploratory & Artistic Prize)

Source: https://andreiaslribeiro.github.io/the-garden/

Tagged: animated, javascript, d3.js

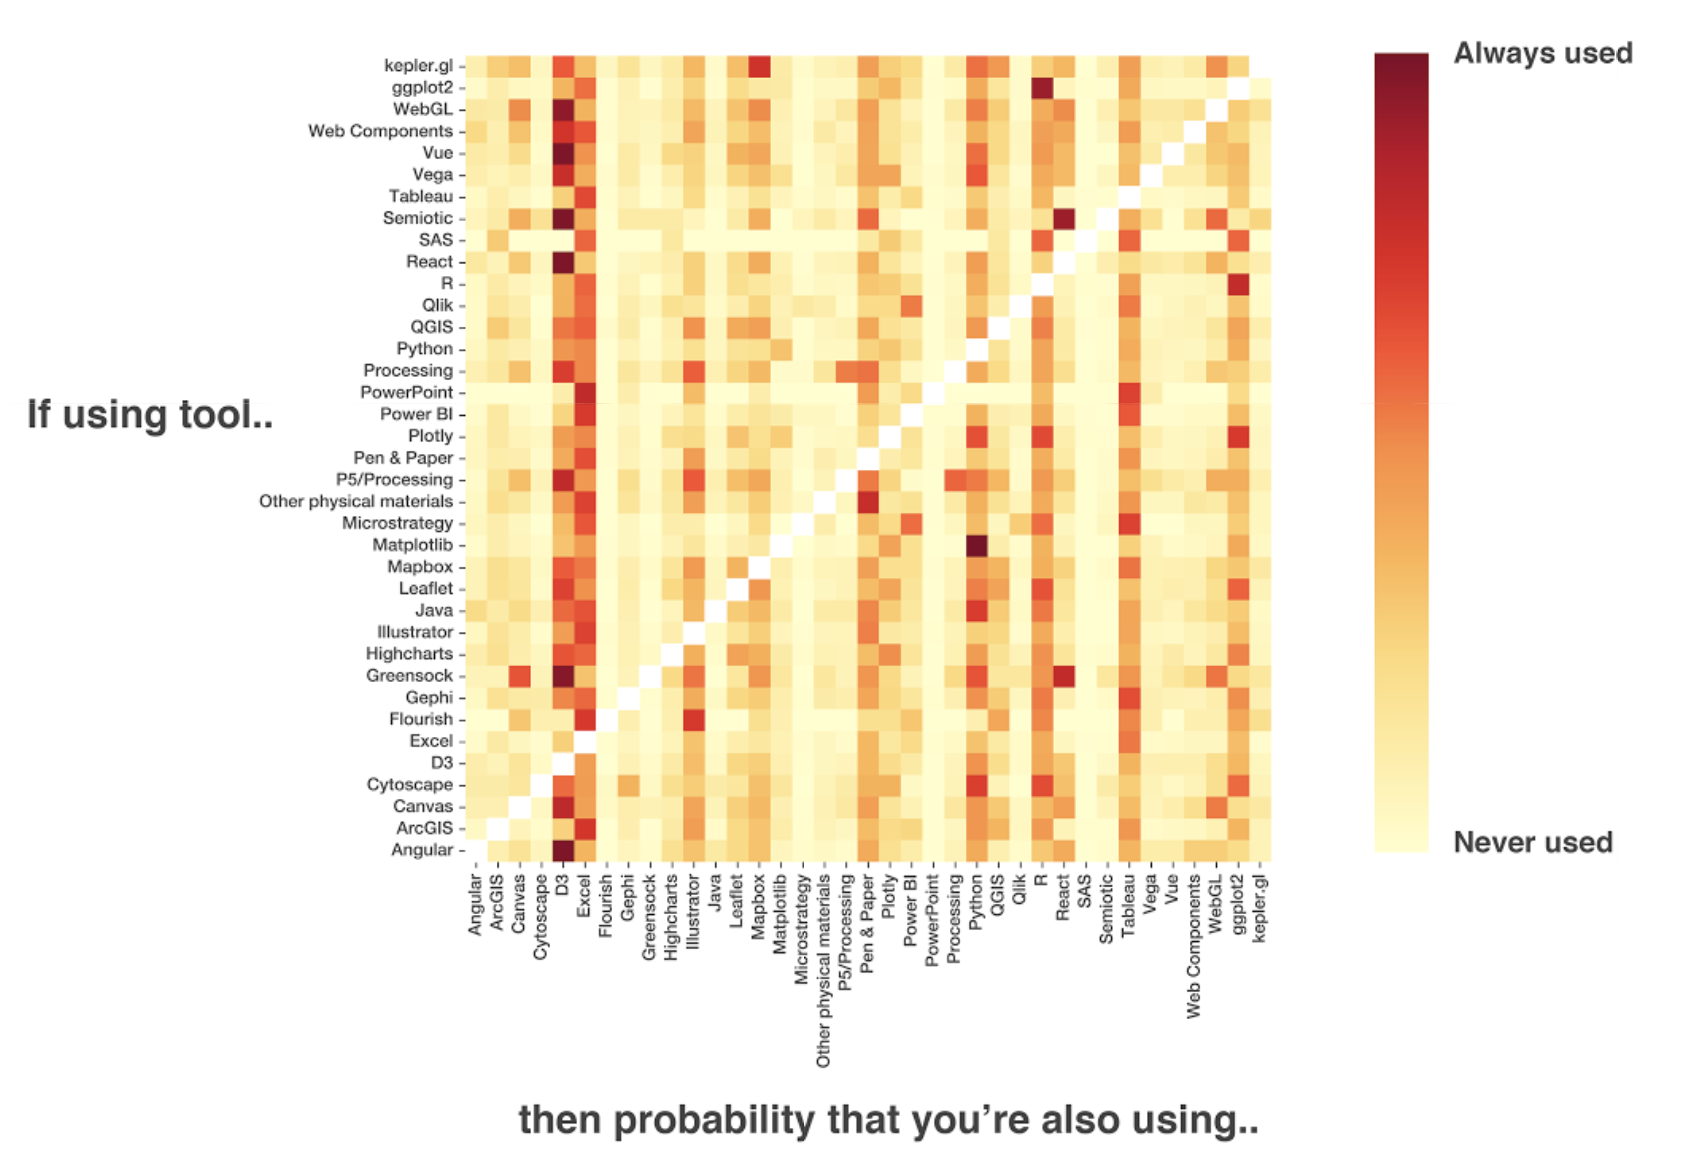
Guest User
November 9, 2019
exploratory

The Data Visualisation Toolkits

Guest User
November 9, 2019
exploratory
The Data Visualisation Toolkits

created by Madison Cotteret

Tagged: map, plot, python, hand-made, sick

Guest User
November 9, 2019
exploratory

Semantic Scatterplot- BERT Directed Layout

Guest User
November 9, 2019
exploratory
Semantic Scatterplot- BERT Directed Layout

created by Robert Christie

Source: http://dvs-survey.s3-website-us-east-1.amazonaws.com/

Tagged: plot, python, javascript, NLP, Machine Learning, Dimensionality Reduction

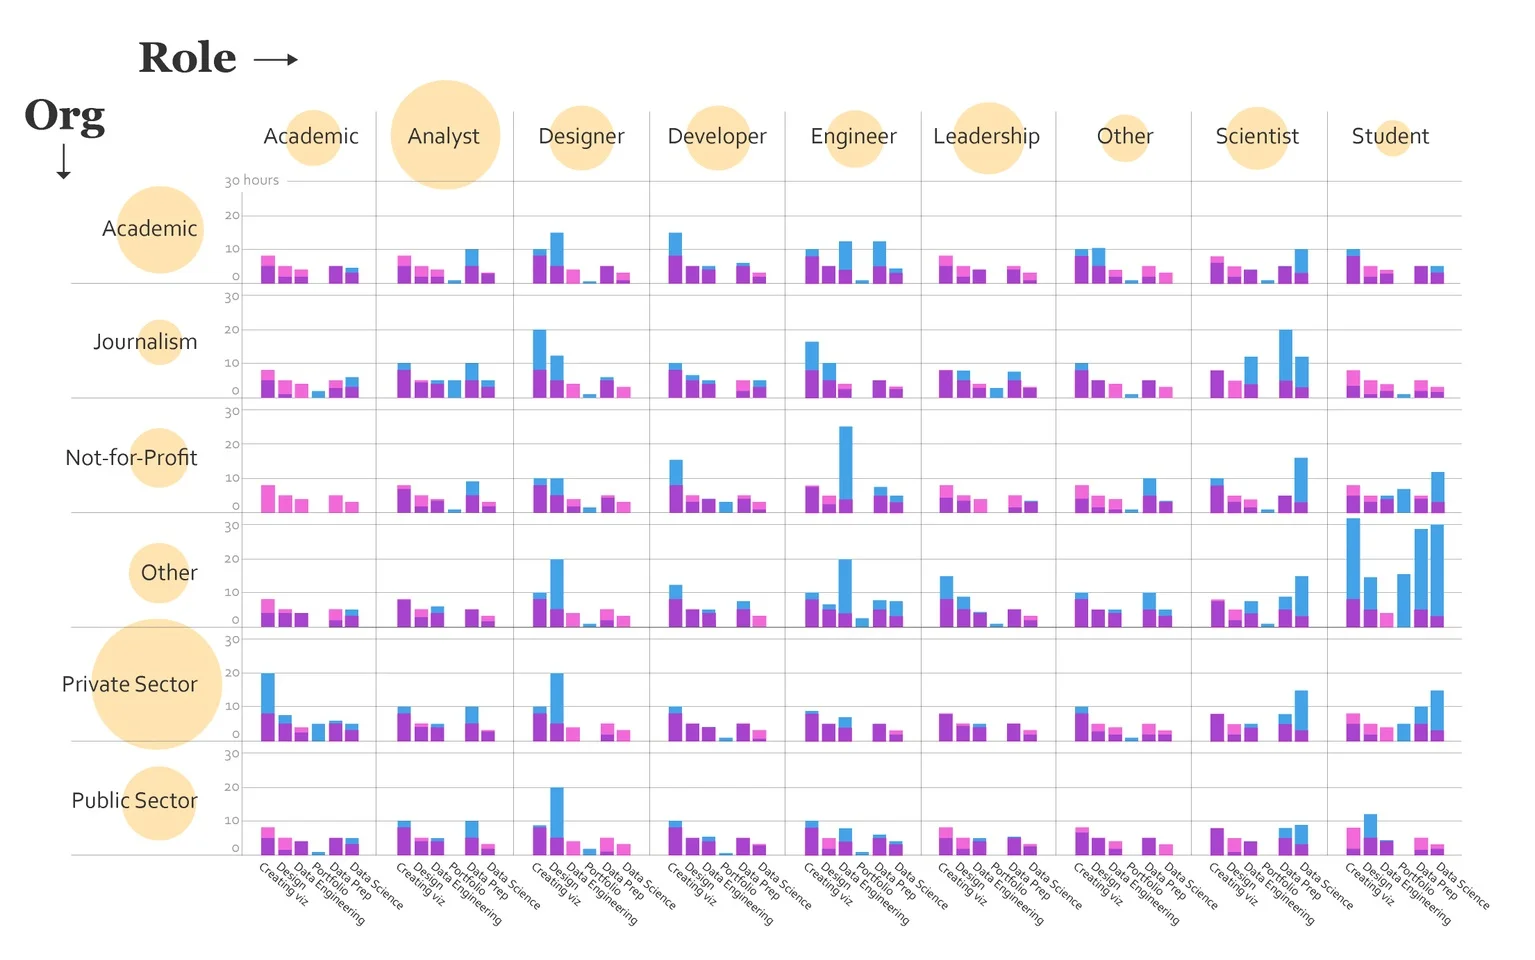
Guest User
November 9, 2019
exploratory

Looking for a job doing data visualization?

Guest User
November 9, 2019
exploratory
Looking for a job doing data visualization?

created by Alli Torban

Source: https://dataviztoday.com/mywork/dvs2019

Tagged: bi tool, graphics editor

Guest User
November 9, 2019
exploratory

DVS 2019 survey Visualization

Guest User
November 9, 2019
exploratory
DVS 2019 survey Visualization

Created by Jatin Balodhi

Source: https://jatinbalodhi96.github.io/dvs_challenge2/

Tagged: animated, plot, javascript, d3, plotly, html, css, jquery, JS

Guest User
October 22, 2019
exploratory

Data Visualization Survey 2019 Dashboard

Guest User
October 22, 2019
exploratory
Data Visualization Survey 2019 Dashboard

by Jennifer Li (1st Place in Exploratory)

Source: https://datastudio.google.com/open/1SRA00XsWA-ycLrX2OXjCnhzdoOhcoJtD

Tagged: dashboard

Guest User
October 22, 2019
exploratory

Annual Data Visualization Community Survey for 2019 SURVEY RESULTS

Guest User
October 22, 2019
exploratory
Annual Data Visualization Community Survey for 2019  SURVEY RESULTS

by Steve Wexler, Data Revelations (2nd Place in Exploratory)

Source: https://public.tableau.com/views/DataRevelations_DataVizSociety_Survey2019/Home?:embed=y&:display_count=yes&publish=yes&:origin=viz_share_link

Tagged: dashboard, tableau

Newer Posts
Back to Top
datavisualizationsociety@gmail.com

Code of Conduct | Bylaws | Privacy Policy | X | Bluesky | Instagram | LinkedIn | YouTube | Merch Store | Brand Guidelines | Contact us