home
Memberships
General Membership
Institutional Memberships
News
For Members
Member Portal
Dataviz Research Recruitment
Slack Community
Programs
Outlier
Mentorship
Dataviz Events Calendar
Reports
State of the Data Viz Industry Survey
Challenges
Affiliated Groups
IIB Awards
Nightingale
Order Nightingale Magazine
Nightingale
Write For Nightingale
Digital Version of Nightingale Print Magazine
Jobs Board
About
Mission
Support DVS
Board and Council
Committees
Nominations
Work With Us

Data Visualization Society

home
Memberships
General Membership
Institutional Memberships
News
For Members
Member Portal
Dataviz Research Recruitment
Slack Community
Programs
Outlier
Mentorship
Dataviz Events Calendar
Reports
State of the Data Viz Industry Survey
Challenges
Affiliated Groups
IIB Awards
Nightingale
Order Nightingale Magazine
Nightingale
Write For Nightingale
Digital Version of Nightingale Print Magazine
Jobs Board
About
Mission
Support DVS
Board and Council
Committees
Nominations
Work With Us
Guest User
November 10, 2019
explanatory

Imposter syndrome in the Data Visualization Society

Guest User
November 10, 2019
explanatory
Imposter syndrome in the Data Visualization Society

created by Maria Alex Ilie (3rd Place in Explanatory)

Source: https://public.tableau.com/profile/maria.alexandra.ilie#!/vizhome/DatavizSocietyChallengerevised/Dashboard1

Tagged: Tableau

Guest User
November 10, 2019
explanatory

Finding the right tool for the job

Guest User
November 10, 2019
explanatory
Finding the right tool for the job

created by Matthew Garrod

Tagged: plot, python

Guest User
November 10, 2019
explanatory

Distribution of yearly pay by gender

Guest User
November 10, 2019
explanatory
Distribution of yearly pay by gender

created by Georgios Karamanis (1st Place in Explanatory & Diversity Prize)

Tagged: plot, r

Guest User
November 10, 2019
explanatory

Considering a Career in Data Vis?

Guest User
November 10, 2019
explanatory
Considering a Career in Data Vis?

created by Darren Aitchison

Tagged: bi tool, Qlikview

Guest User
November 10, 2019
explanatory

Communities within Communities

Guest User
November 10, 2019
explanatory
Communities within Communities

created by Amber Hoak (3rd Place in Explanatory)

Source: https://observablehq.com/@ahoak/dvs-communities-within-communities

Tagged: javascript

Guest User
November 10, 2019
explanatory

What focus is Data Visualisation in your work?

Guest User
November 10, 2019
explanatory
 What focus is Data Visualisation in your work?

created by Wendy Small

Source: https://public.tableau.com/views/DVSChallenge3/Dashboard1?:embed=y&:display_count=yes&publish=yes&:origin=viz_share_link

Tagged: bi tool, Excel

Guest User
November 10, 2019
explanatory

Tools of the trade

Guest User
November 10, 2019
explanatory
Tools of the trade

created by Alexandra Khoo

Tagged: python, graphics editor, hand-made

Guest User
November 10, 2019
explanatory

Story of Data Visualization Education

Guest User
November 10, 2019
explanatory
Story of Data Visualization Education

created by Gauri Tillu

Source: https://public.flourish.studio/story/88973/

Tagged: plot, Flourish Sankey Diagram

Guest User
November 10, 2019
explanatory

Skipped!

Guest User
November 10, 2019
explanatory
Skipped!

created by Prachi Tank (2nd Place in Explanatory)

Source: https://docs.google.com/spreadsheets/d/1s5GX38KZv998cqN8p0HwWOff6SDWVI44ihH1qWGv4bc/edit?usp=sharing

Tagged: spreadsheets

Guest User
November 10, 2019
explanatory

Rate by Role and LGBT Status

Guest User
November 10, 2019
explanatory
Rate by Role and LGBT Status

created by Barbara Donnini - Boxplot Analytics

Tagged: plot, python

Guest User
November 9, 2019
explanatory

One fact about number of charts you create and time you spend on data preparation

Guest User
November 9, 2019
explanatory
One fact about number of charts you create and time you spend on data preparation

created by Konstantin Zhitkov

Tagged: animated, plot, r

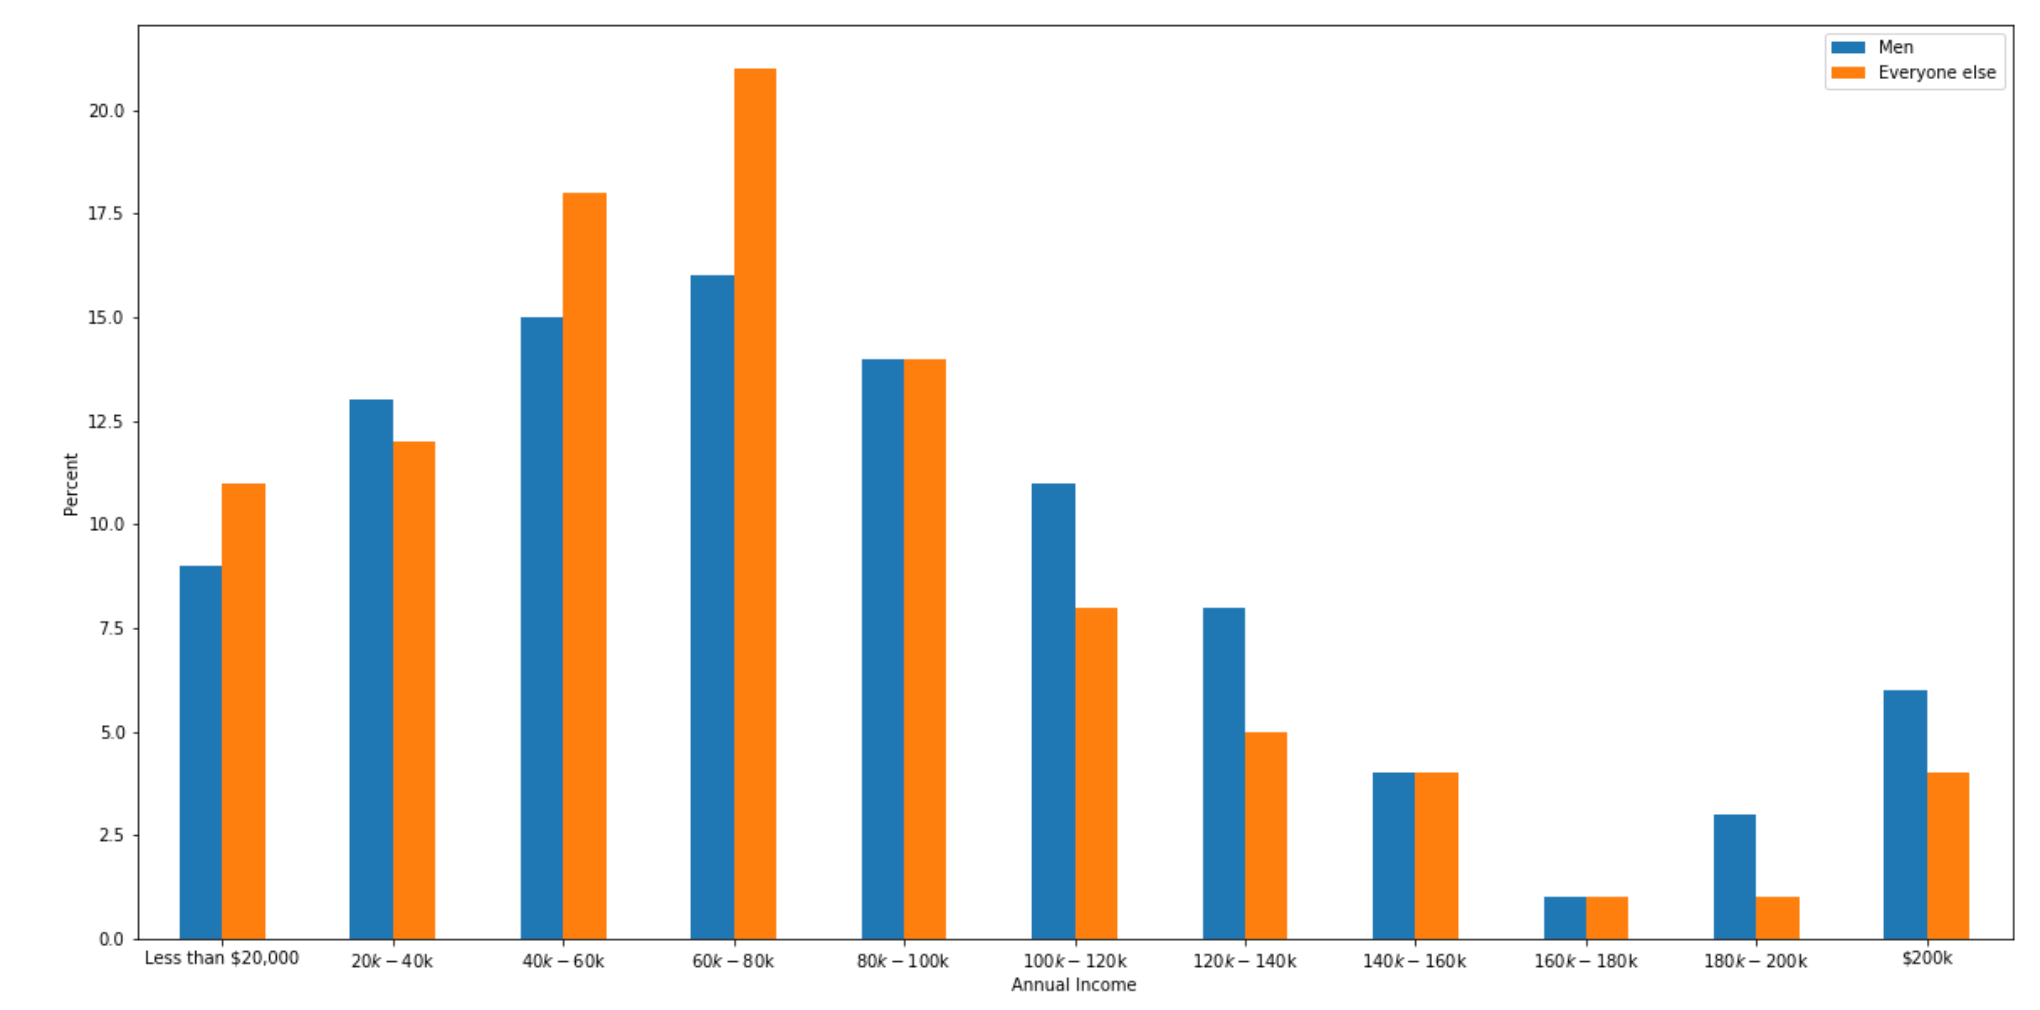
Guest User
November 9, 2019
explanatory

Income distribution by gender

Guest User
November 9, 2019
explanatory
Income distribution by gender

created by Kathy

Tagged: python

Guest User
November 9, 2019
explanatory

Diversions in Diversity

Guest User
November 9, 2019
explanatory
Diversions in Diversity

created by Jonathan Yu

Source: https://public.tableau.com/profile/jons1691#!/vizhome/DVS5/expla

Tagged: first time submitter, tableau, newbie

Guest User
November 9, 2019
explanatory

A career in Data Visualisation: Insights into learning methods.

Guest User
November 9, 2019
explanatory
A career in Data Visualisation: Insights into learning methods.

created by Armani Eloise

Source: https://public.tableau.com/profile/armani.eloise7449#!/vizhome/DVSCompetition/D1

Tagged: bi tool, Tableau

Guest User
November 9, 2019
exploratory

What We Viz With

Guest User
November 9, 2019
exploratory
What We Viz With

created by Rishi Vanukuru

Source: https://rishivanukuru.shinyapps.io/DVS-Challenge/

Tagged: r, R Shiny, Network Visualization

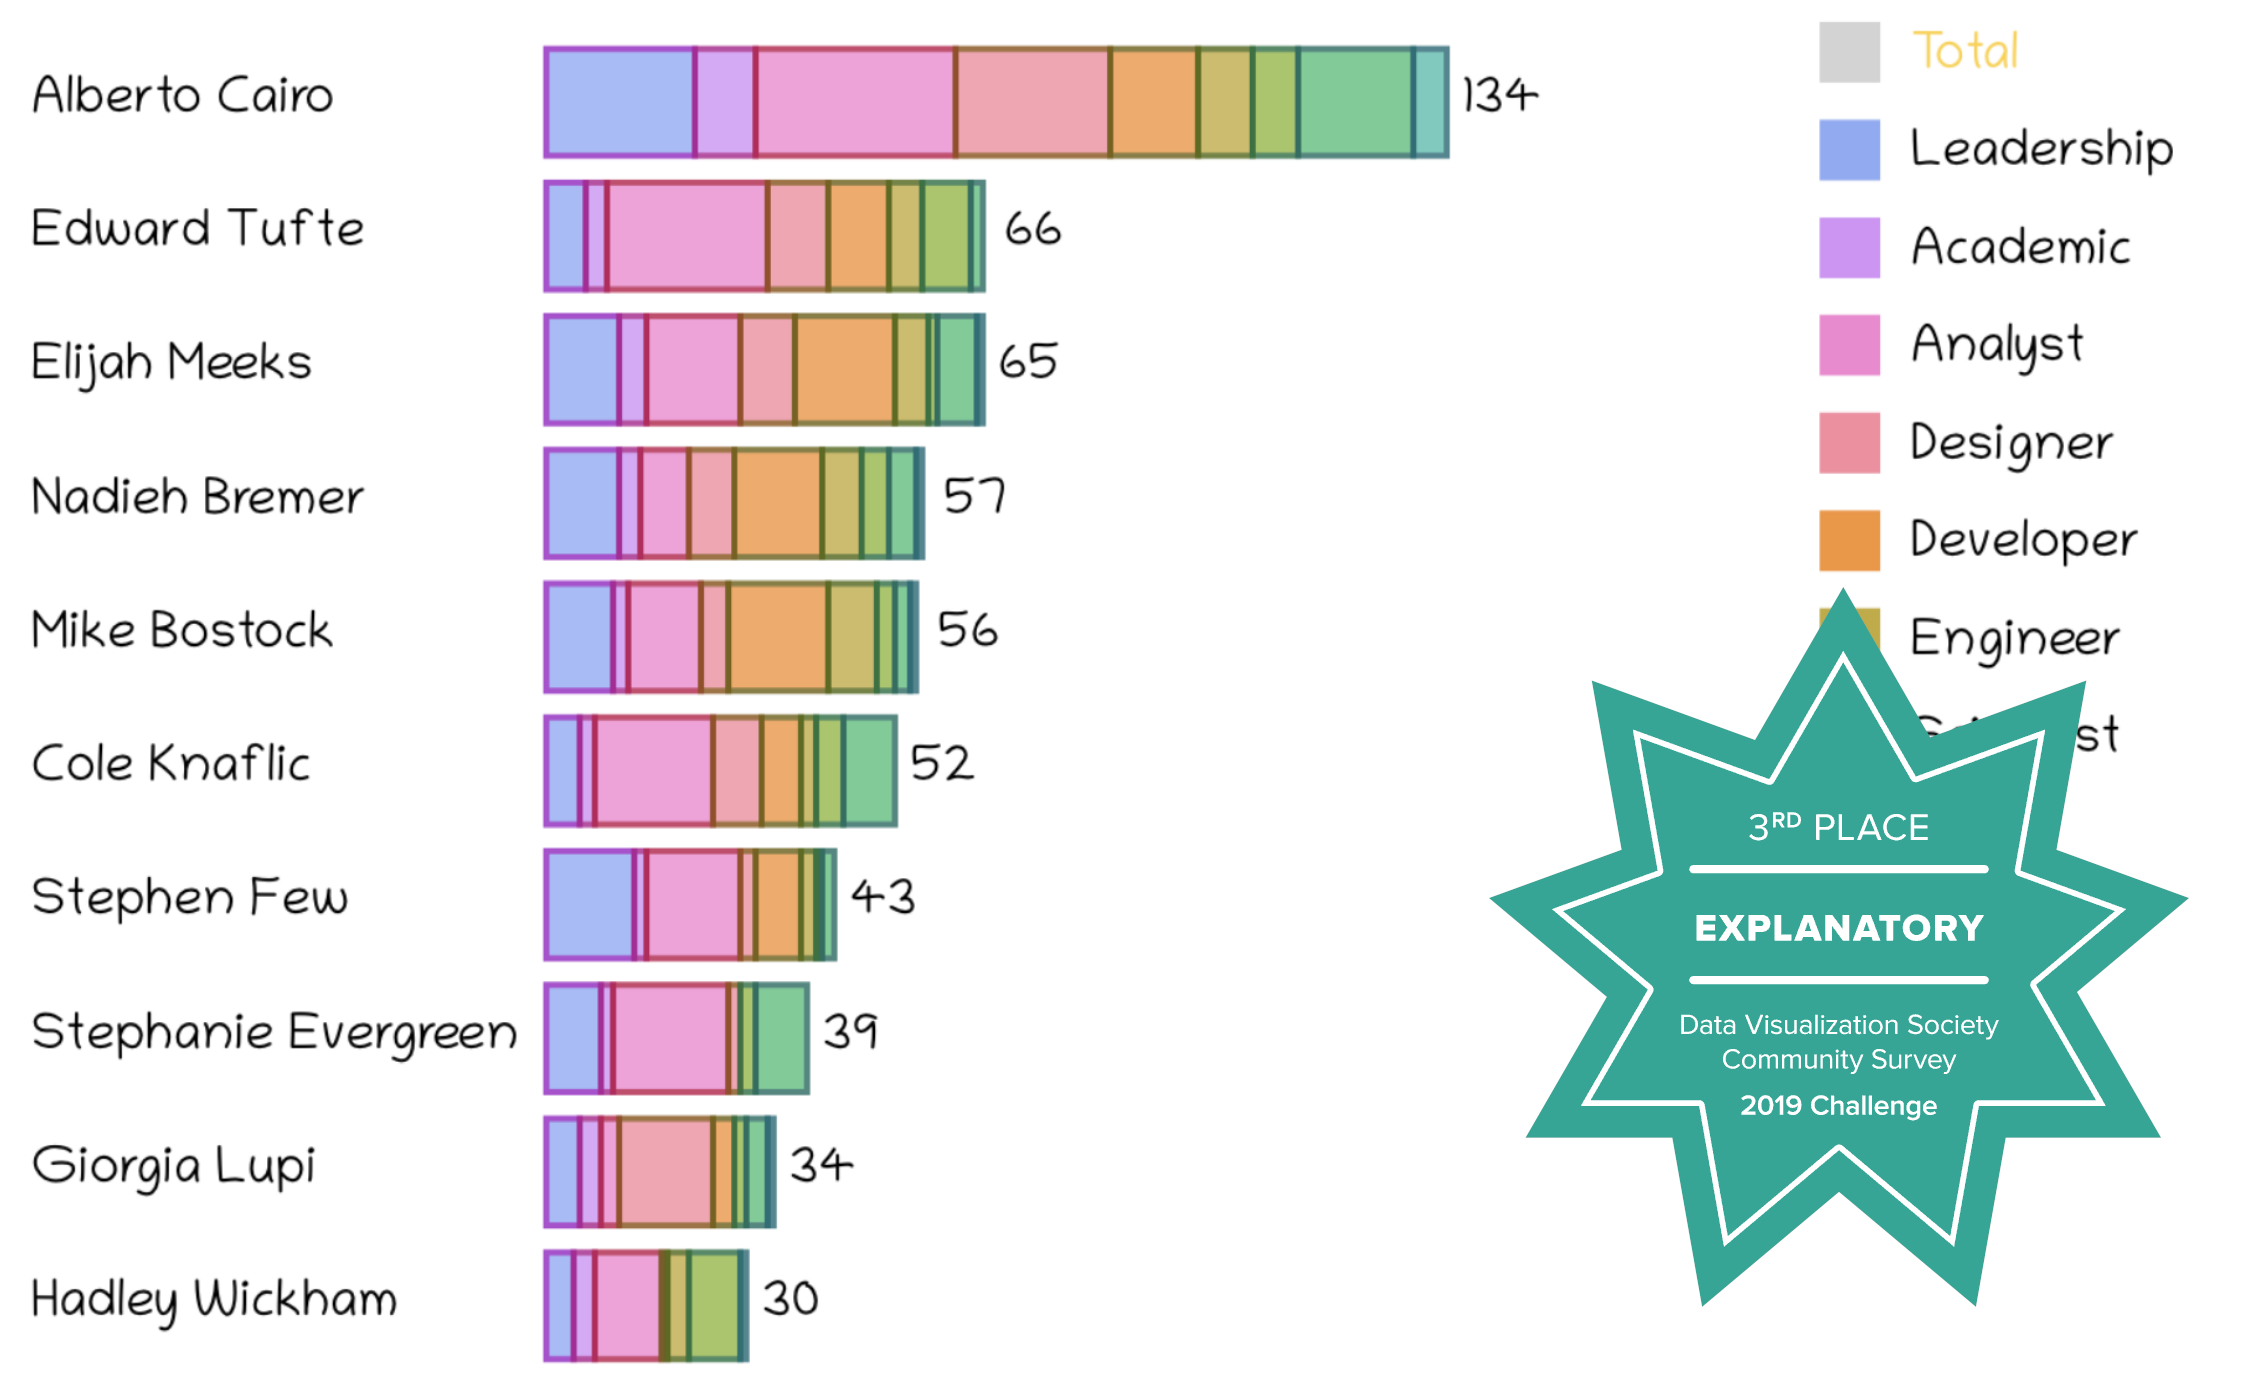
Guest User
November 9, 2019
exploratory

Thought Leaders in Data Viz.

Guest User
November 9, 2019
exploratory
Thought Leaders in Data Viz.

created by Mayura Datar

Source: https://public.flourish.studio/story/88811/

Tagged: plot

Guest User
November 9, 2019
exploratory

Surveez

Guest User
November 9, 2019
exploratory
Surveez

created by Rapid Developer

Source: https://surveez.netlify.com/

Tagged: animated, plot, javascript

Guest User
November 9, 2019
exploratory

Let's get cray, yearly pay!

Guest User
November 9, 2019
exploratory
Let's get cray, yearly pay!

created by Christina Chen

Source: https://public.tableau.com/profile/xtinachen#!/

Tagged: map, animated, tableau

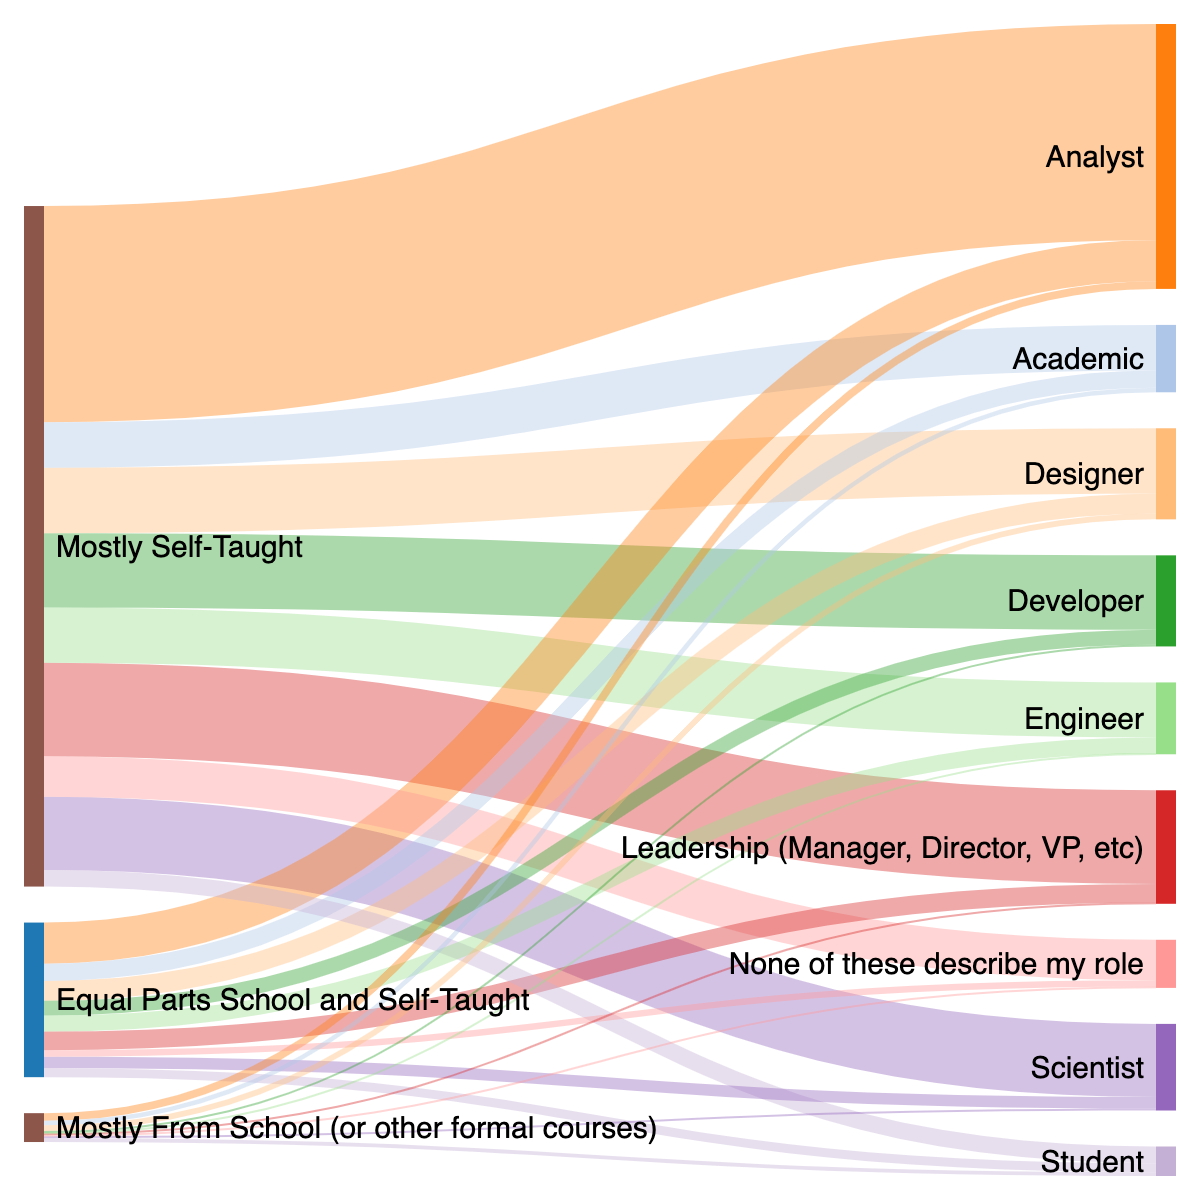
Guest User
November 9, 2019
exploratory

Industry Flow Based on Data Education

Guest User
November 9, 2019
exploratory
Industry Flow Based on Data Education

created by Barbara Donnini - Boxplot Analytics

Tagged: python, javascript

Guest User
November 9, 2019
exploratory

How Represented Are You In The Dataviz Community?

Guest User
November 9, 2019
exploratory
How Represented Are You In The Dataviz Community?

created by Joseph Ricafort (3rd Place in Exploratory)

Source: https://blog.josericafort.com/posts/dataviz-community-survey-representation-diversity/

Tagged: r, graphics editor, illustrator

Older Posts
Back to Top
datavisualizationsociety@gmail.com

Code of Conduct | Bylaws | Privacy Policy | X | Bluesky | Instagram | LinkedIn | YouTube | Merch Store | Brand Guidelines | Contact us