home
Memberships
General Membership
Institutional Memberships
News
For Members
Member Portal
Dataviz Research Recruitment
Slack Community
Programs
Outlier
Mentorship
Dataviz Events Calendar
Reports
State of the Data Viz Industry Survey
Challenges
Affiliated Groups
IIB Awards
Nightingale
Order Nightingale Magazine
Nightingale
Write For Nightingale
Digital Version of Nightingale Print Magazine
Jobs Board
About
Mission
Support DVS
Board and Council
Committees
Nominations
Work With Us

Data Visualization Society

home
Memberships
General Membership
Institutional Memberships
News
For Members
Member Portal
Dataviz Research Recruitment
Slack Community
Programs
Outlier
Mentorship
Dataviz Events Calendar
Reports
State of the Data Viz Industry Survey
Challenges
Affiliated Groups
IIB Awards
Nightingale
Order Nightingale Magazine
Nightingale
Write For Nightingale
Digital Version of Nightingale Print Magazine
Jobs Board
About
Mission
Support DVS
Board and Council
Committees
Nominations
Work With Us
DATA VISUALIZATION IN 2020: SELF TAUGHT PROFESSIONALS EAGER TO LEARN DESPITE FRUSTRATIONS
February 13, 2021
DVS Census
Amy Cesal
DATA VISUALIZATION IN 2020: SELF TAUGHT PROFESSIONALS EAGER TO LEARN DESPITE FRUSTRATIONS
Amy Cesal
February 13, 2021
DVS Census

DATA VISUALIZATION IN 2020: SELF TAUGHT PROFESSIONALS EAGER TO LEARN DESPITE FRUSTRATIONS

Amy Cesal
February 13, 2021
DVS Census

Created by Brittany Rosenau

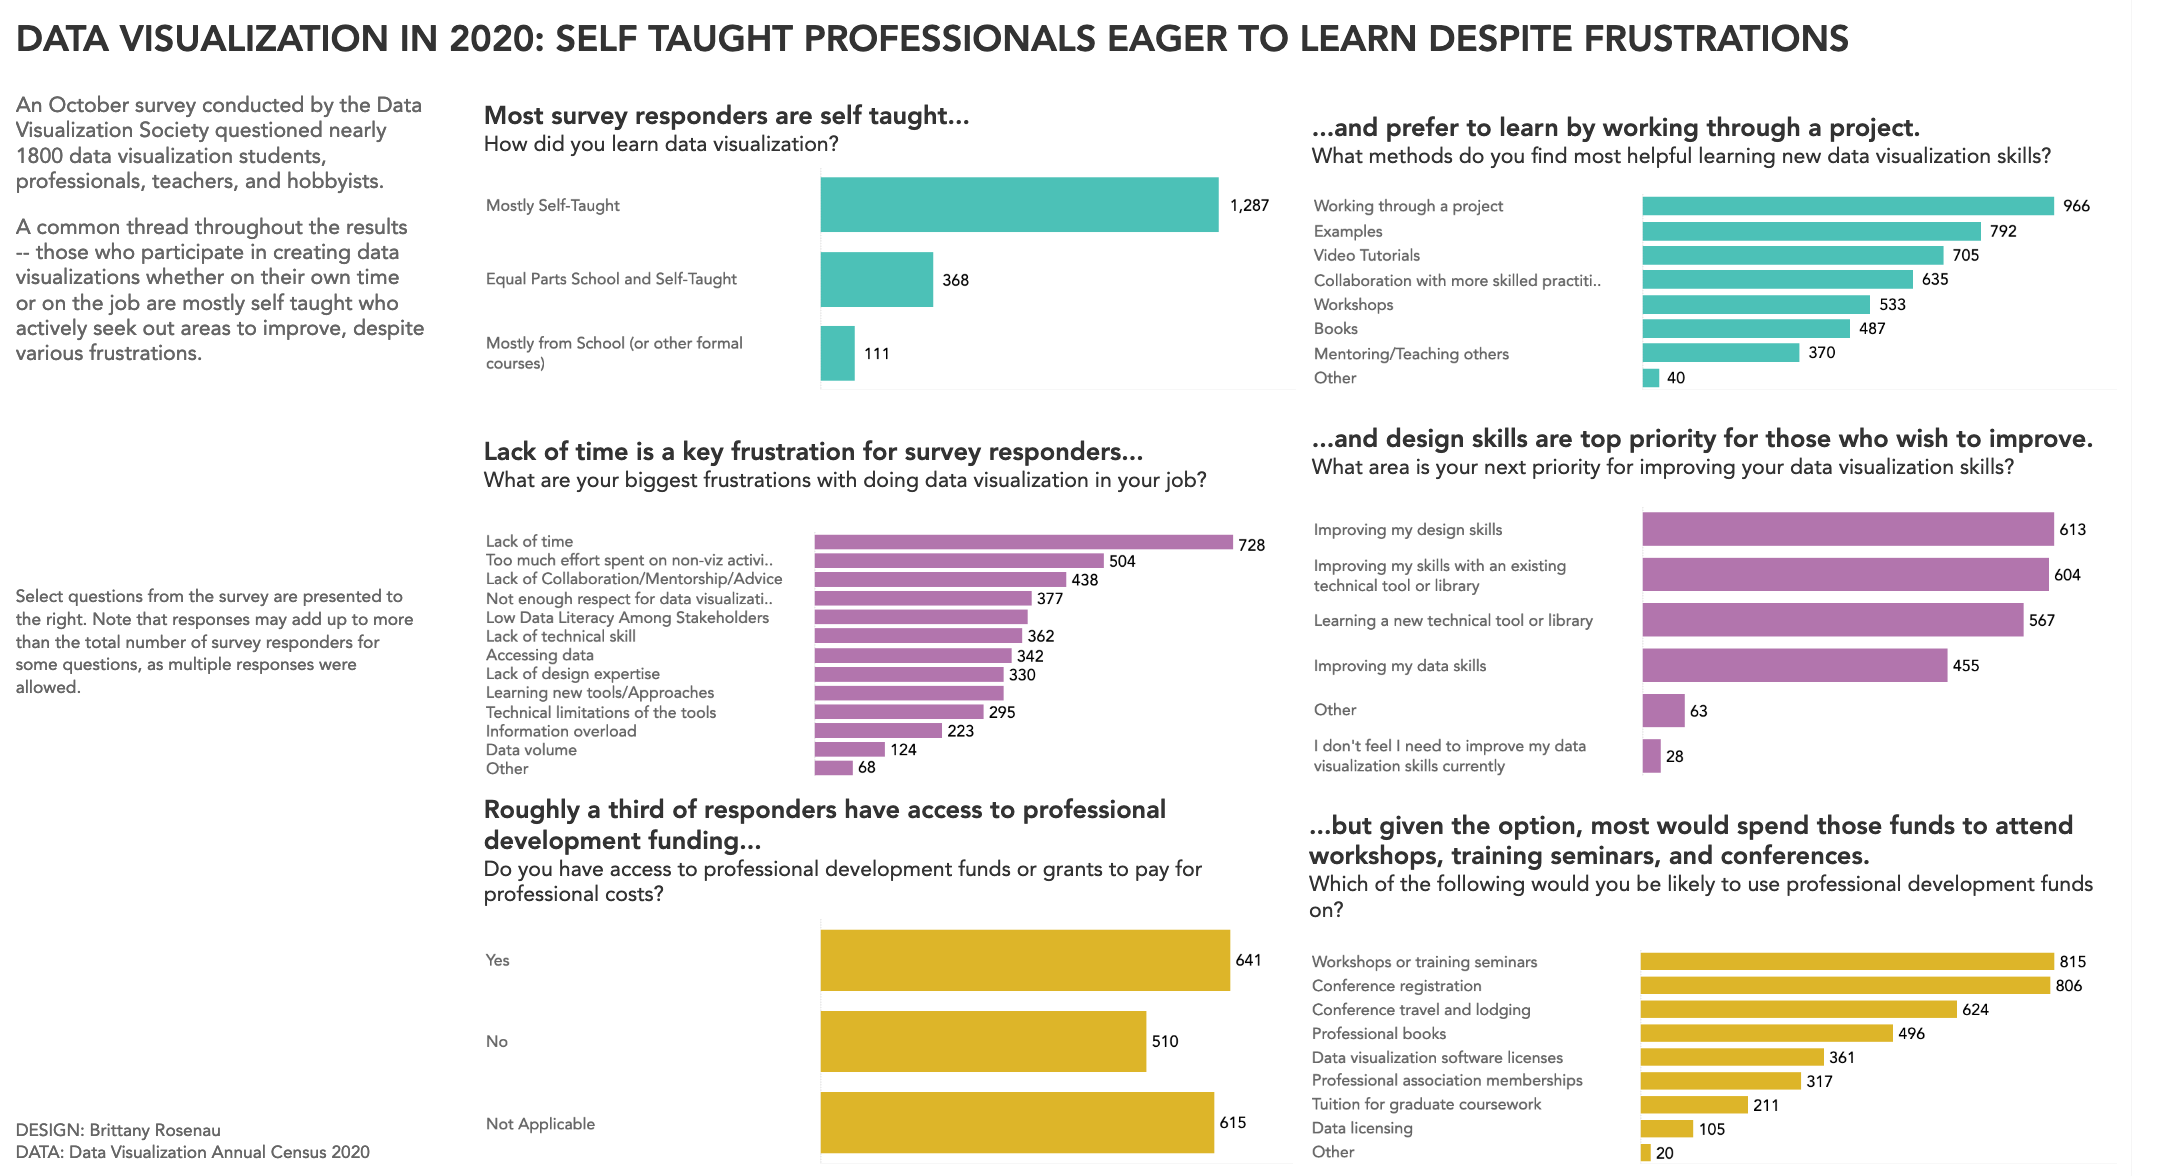
Exploring survey results related to professional development, frustrations, and top priorities for those who visualize data.

Data prep in google sheets, viz in Tableau

https://public.tableau.com/profile/brrosenau#!/vizhome/DVSSurveyResults/DVSSurveyResults

Screen Shot 2021-02-13 at 5.58.14 PM.png

Tagged: EXPLANATORY

Newer PostMaking Gain$ in Data Viz
Older PostCountry wise diversity of application domains of visualisation
Back to Top
datavisualizationsociety@gmail.com

Code of Conduct | Bylaws | Privacy Policy | X | Bluesky | Instagram | LinkedIn | YouTube | Merch Store | Brand Guidelines | Contact us